5. Logging
5.1. On the console
To enable logs, use the following command.
vrouter running config# vrf main cg-nat logging enabled true
vrouter running config# commit
This command displays the CG-NAT logs on the console:
vrouter running config# show log service cg-nat
-- Logs begin at Thu 2019-07-18 11:50:25 UTC, end at Thu 2019-07-18 15:28:05 UTC. --
Jun 11 08:02:46 vrouter systemd[1]: Started Fast Path cgnat log daemon.
Jun 11 08:02:46 vrouter fp-cgnat-logd@main[4269]: CGNAT Log listen on 5001
Jun 11 08:03:09 vrouter fp-cgnat-logd@main[4269]: USER 100.64.0.1 (matching rule 1): NEW BLOCK (ip public 32.96.119.1, proto 6, port 1024 - 1536) at Tue Jun 11 08:03:09 2019
Jun 11 08:07:30 vrouter fp-cgnat-logd@main[4269]: USER 100.64.0.1 (matching rule 1): DESTROY BLOCK (ip public 32.96.119.1, proto 6, port 1024 - 1536) at Tue Jun 11 08:07:30 2019
5.2. Towards an external framework
In this section, we will explain how to export CG-NAT logs to an external logging framework. As an example, we will use the ELK stack (ElasticSearch, Logstash and Kibana) from the Elastic Stack to gather the logs and display them in a user-friendly way.
We assume that Elastic, Logstash and Kibana have been installed on a server accessible on the 172.16.0.2 IP address, following the Elastic documentation.
Note
The following configuration was done with the 8.x branch of this framework.
CGNAT logs are sent to the rsyslog server using TCP, either in octet-counting or non-transparent framing mode. Ensure TCP is enable in rsyslog configuration file. For more details about framing mode, see RFC 6587.
# provides TCP syslog reception
module(load="imtcp")
input(type="imtcp" port="10514")
Here is the Logstash configuration we will be using, including the IP address and port of the syslog server and filters to parse and format the CG-NAT log messages before storing them in Elastic:
input {
  tcp {
    host => "172.16.0.2"
    port => 10514
    type => syslog
  }
}

filter {
  if [type] == "syslog" {
    grok {
      match => { "message" => "%{POSINT:syslog_pri}>%{TIMESTAMP_ISO8601:syslog_timestamp} %{SYSLOGHOST:syslog_hostname} %{DATA:syslog_program}(?:\[%{POSINT:syslog_pid}\])?: %{GREEDYDATA:syslog_message}" }
      add_field => [ "received_at", "%{@timestamp}" ]
      add_field => [ "received_from", "%{host}" ]
    }
    date {
      match => [ "syslog_timestamp","ISO8601"]
    }
  }
}

# Second level of filtering specific for CG-NAT logs
filter {
  if [type] == "syslog" {
    if [syslog_program] == "fp-cgnat" {
      grok {
        break_on_match => false
        match => [ "message", "USER %{IP:prv_ip} \(matching rule %{POSINT:rule}\)\: %{DATA:action} BLOCK \(ip public %{IP:pub_ip}\, proto %{POSINT:proto}\, port %{POSINT:start_port} \- %{POSINT:end_port}\)"]
      }

      if "_grokparsefailure" in [tags] { drop {} }
      mutate { add_tag => [ "CG-NAT log" ] }
      translate {
        field => "proto"
        destination => "sproto"
        dictionary => {
          "1" => "ICMP"
          "6" => "TCP"
          "17" => "UDP"
        }
      }
    }
  }
}

output {
  if [type] == "syslog" {
    if [syslog_program] == "fp-cgnat" {
      elasticsearch {
        hosts => [ "127.0.0.1:9200" ]
        index => "logstash-%{+YYYY.MM.dd}"
      }
      stdout {}
    }
  }
}
On the vRouter, logging CGNAT logs to Logstash can be enabled with the following configuration. However, Logstash is not compatible with octet-counting framing-method.
vrouter running config# / vrf main cg-nat logging rsyslog-server 172.16.0.2 port 10514
vrouter running config# / vrf main cg-nat logging framing-method non-transparent-framing
vrouter running config# commit
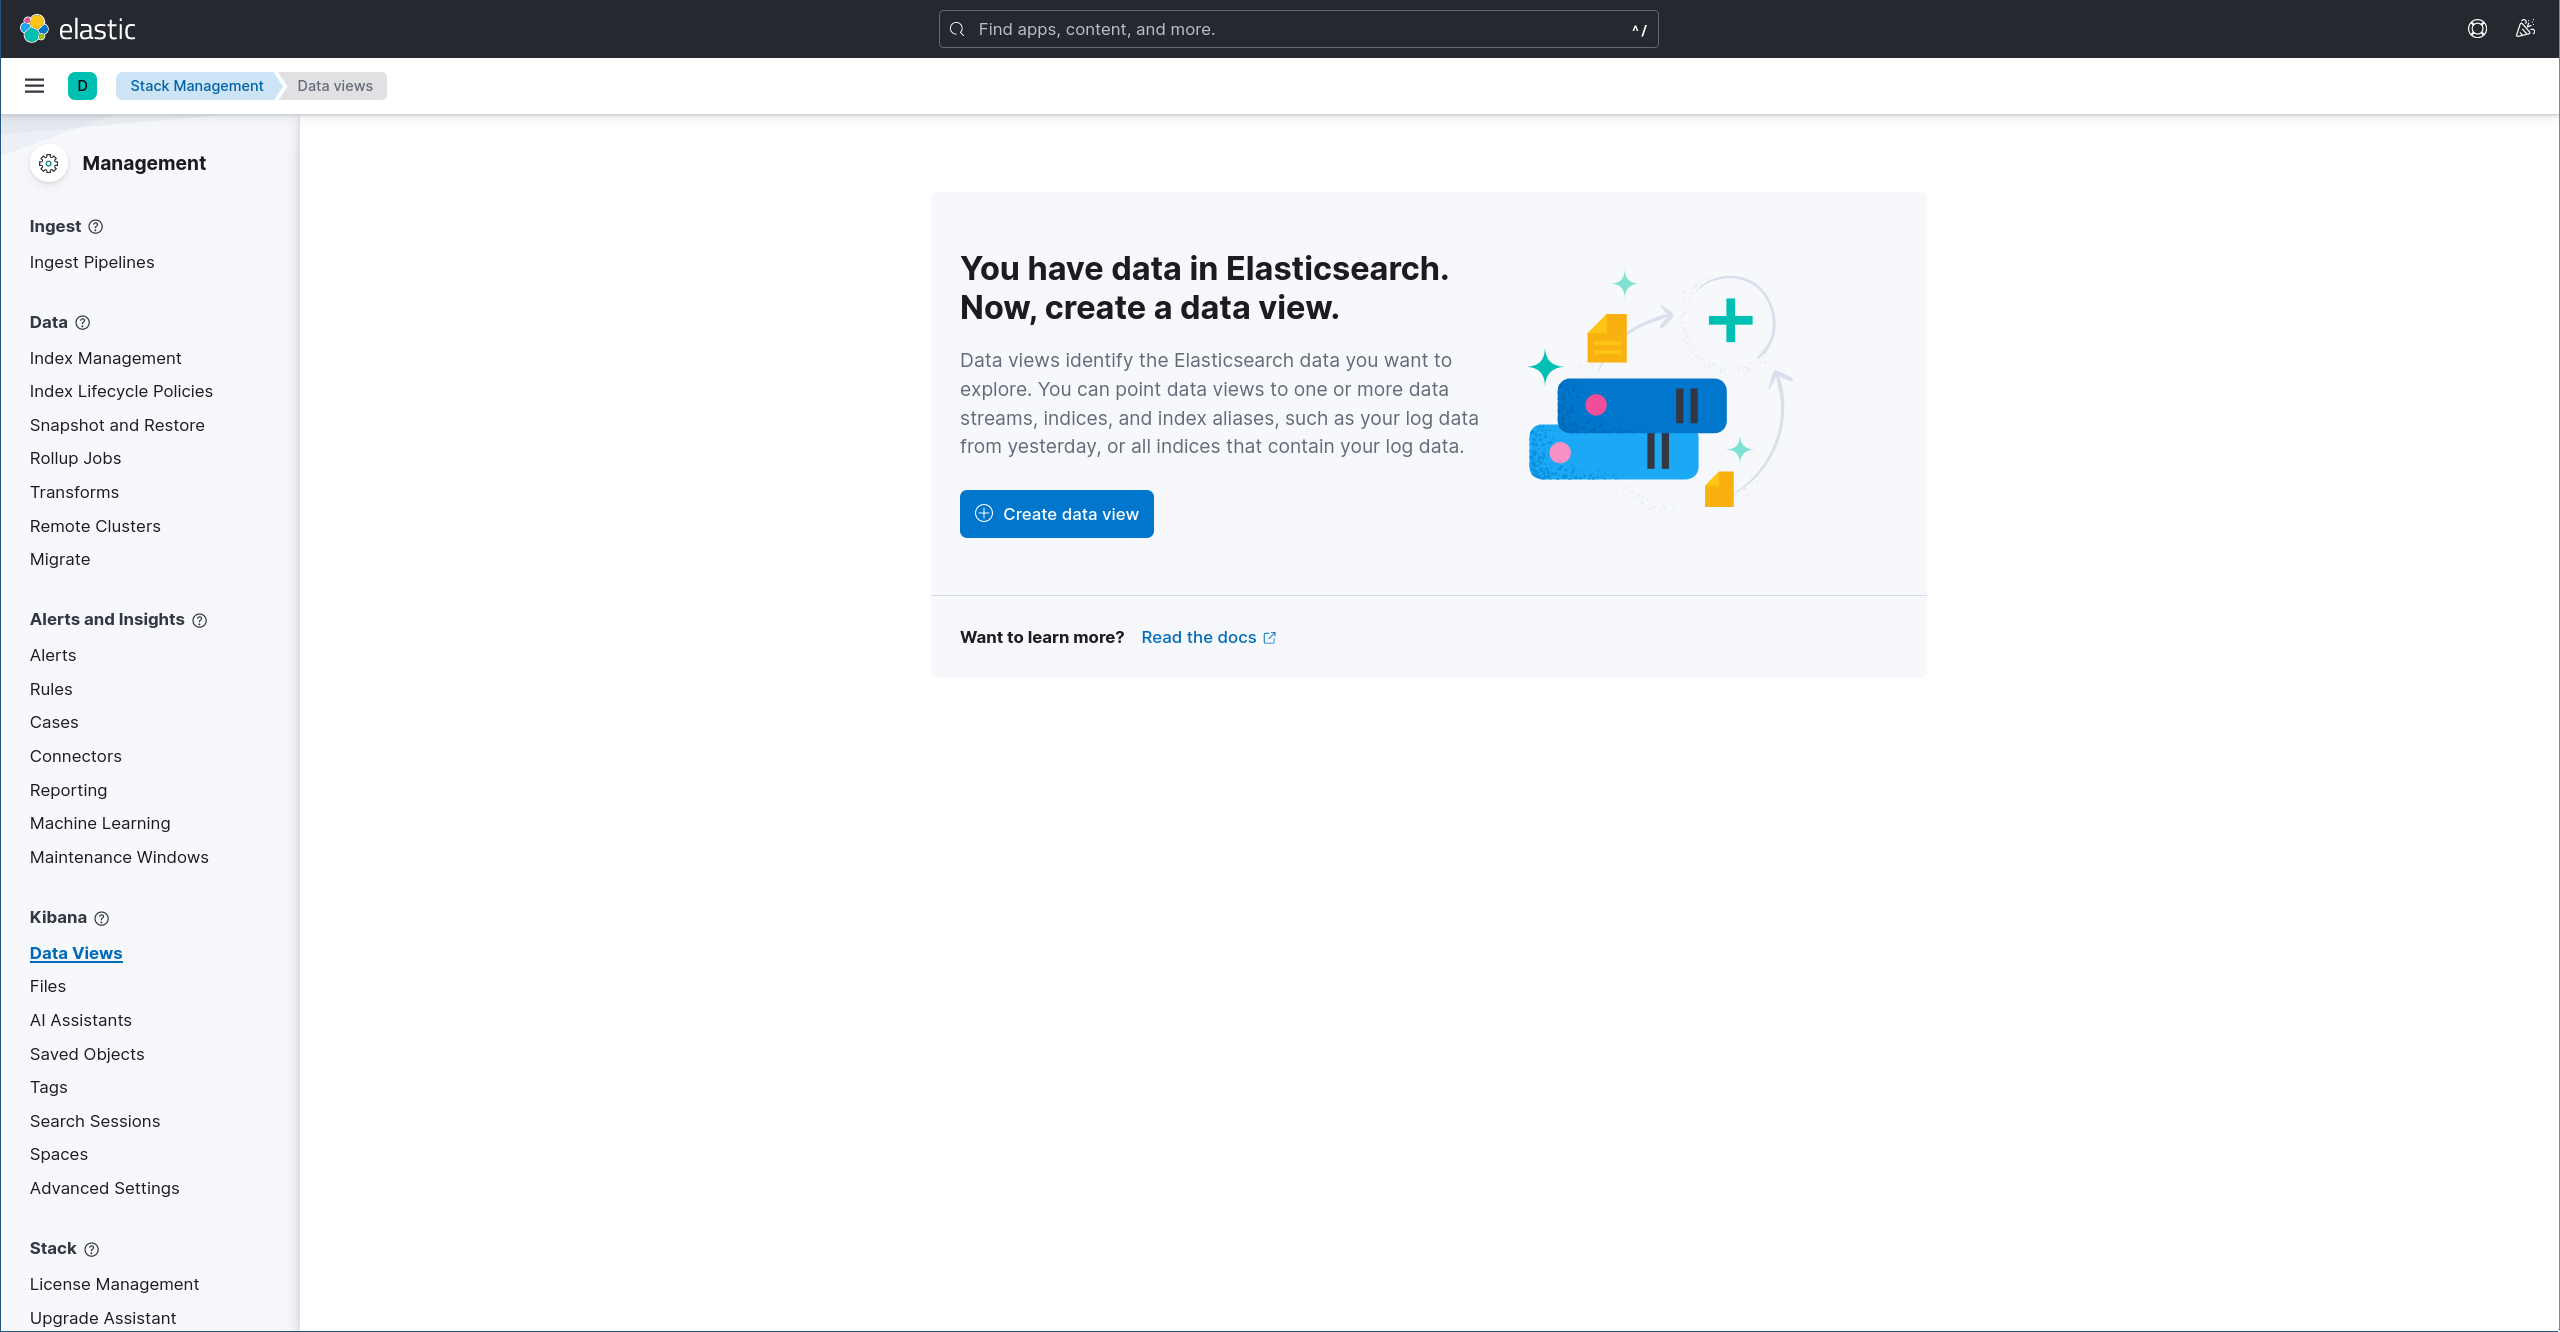
Let’s now connect to Kibana using a web browser, pointing at http://172.16.0.2:5601. Click Stack Management, Data Views, Create data view
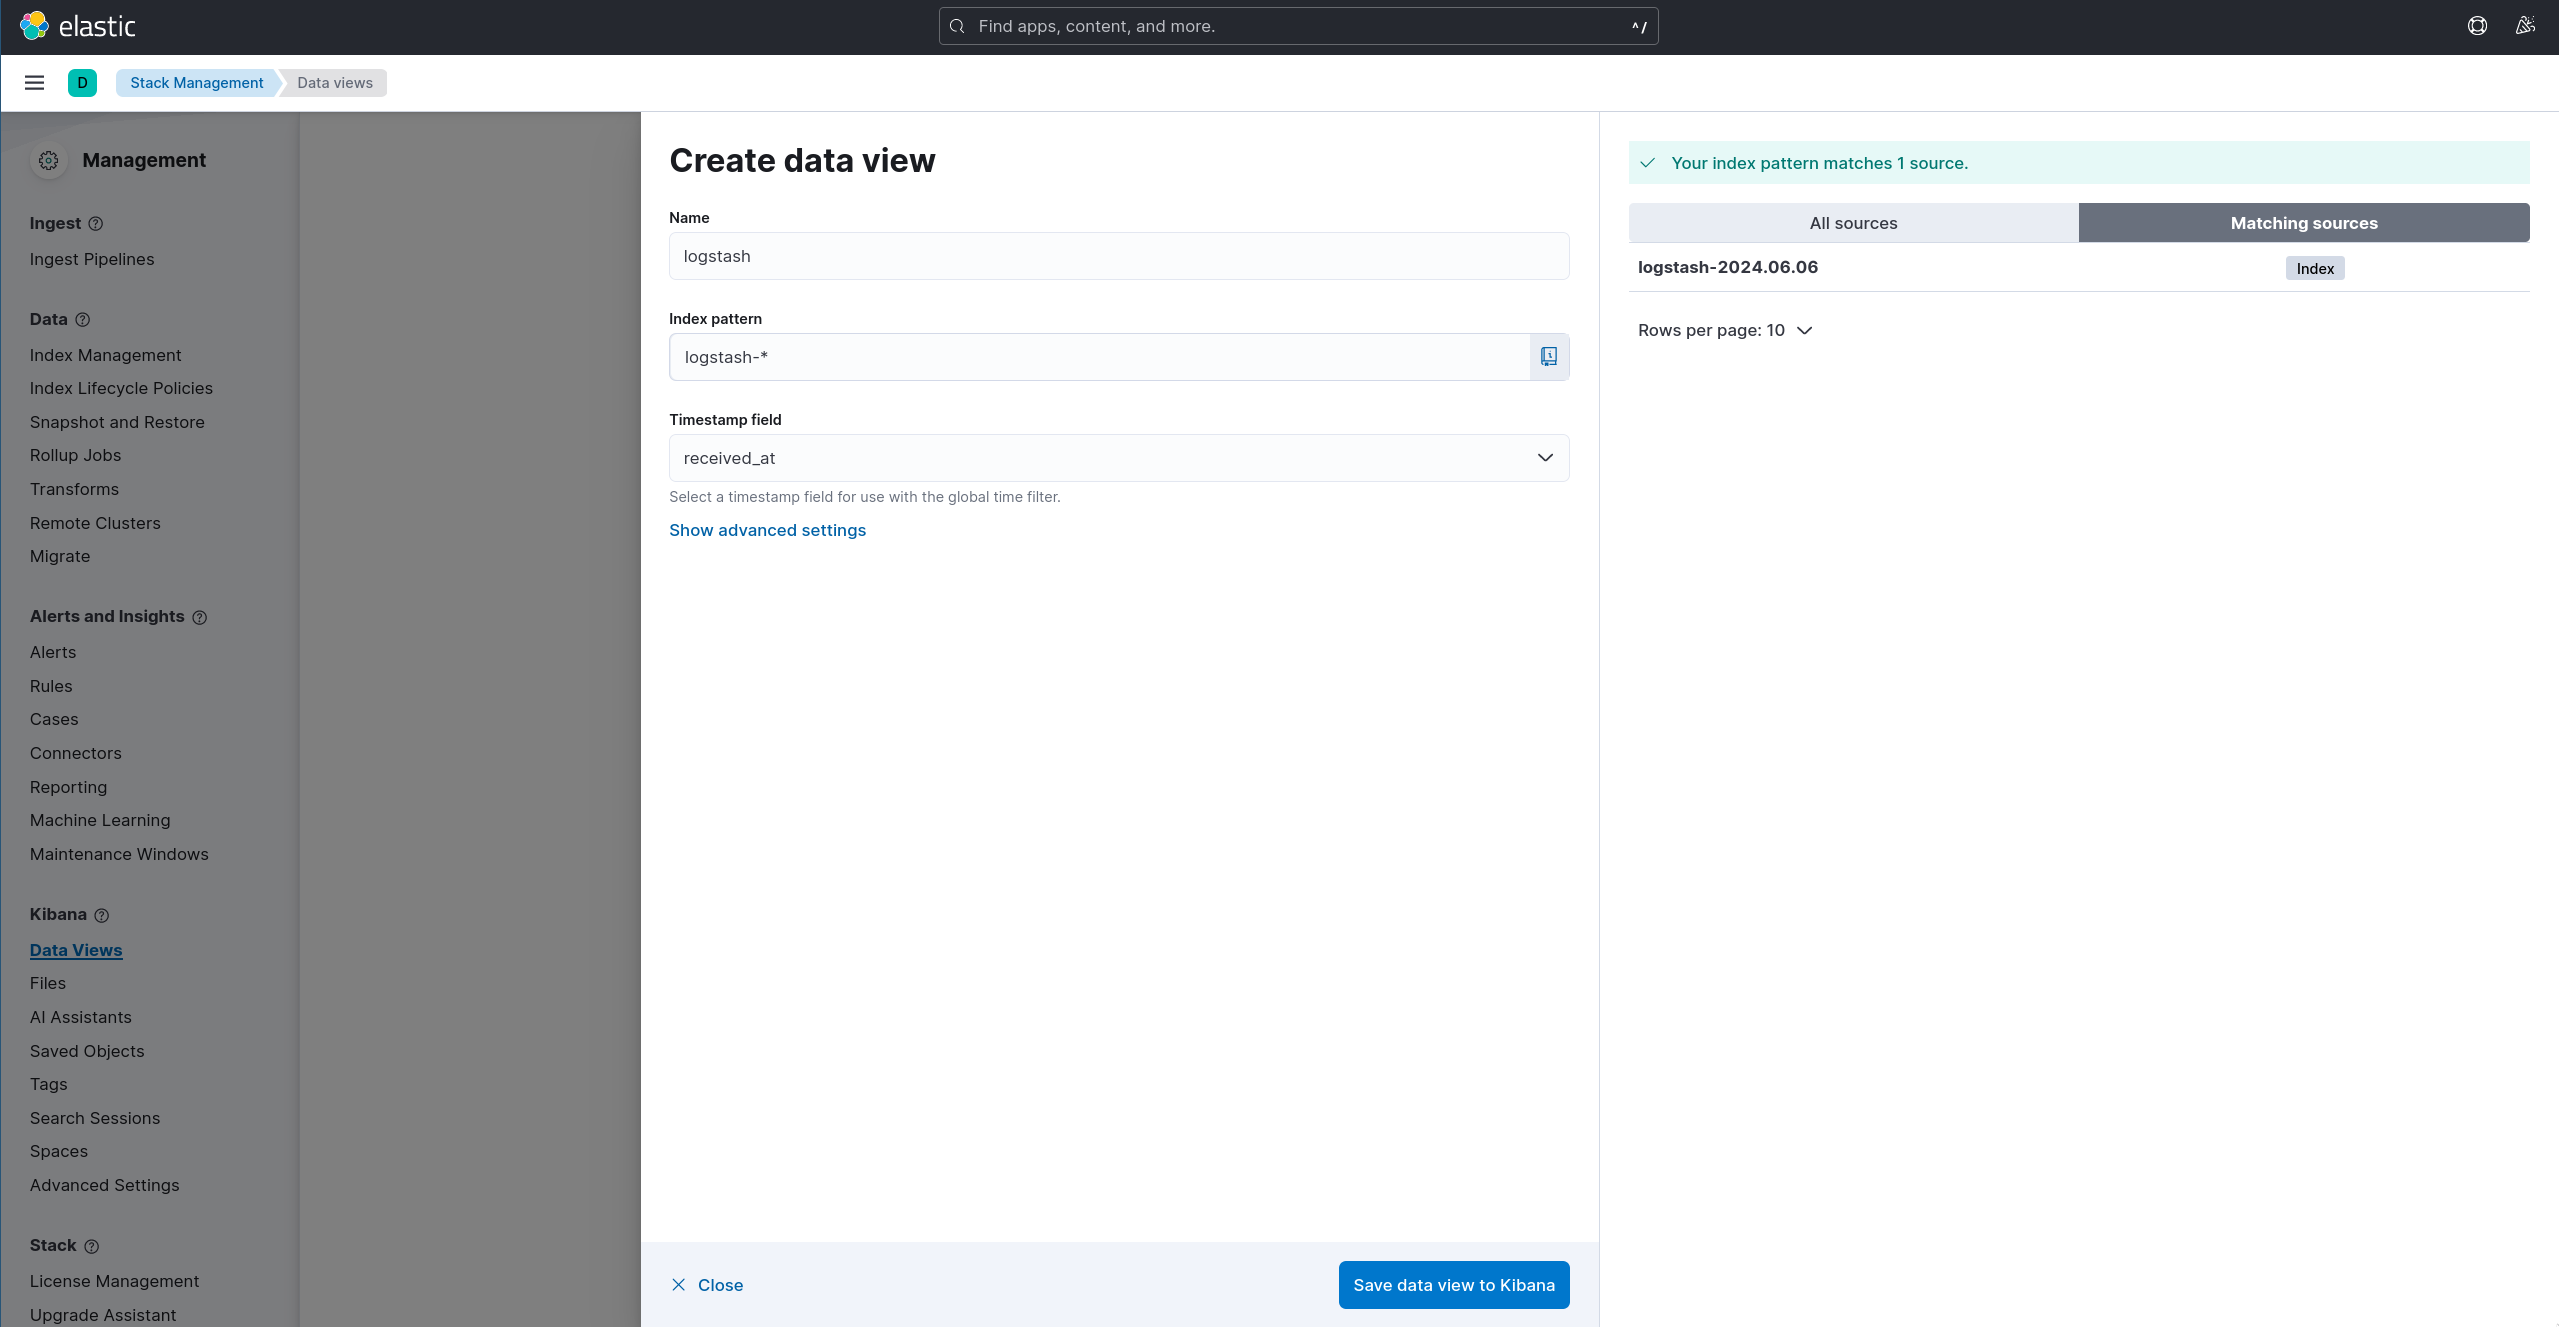
Choose a name, use logstash-* as Index Pattern, select receive_at as the Time Filter field name and click Save data view to Kibana.
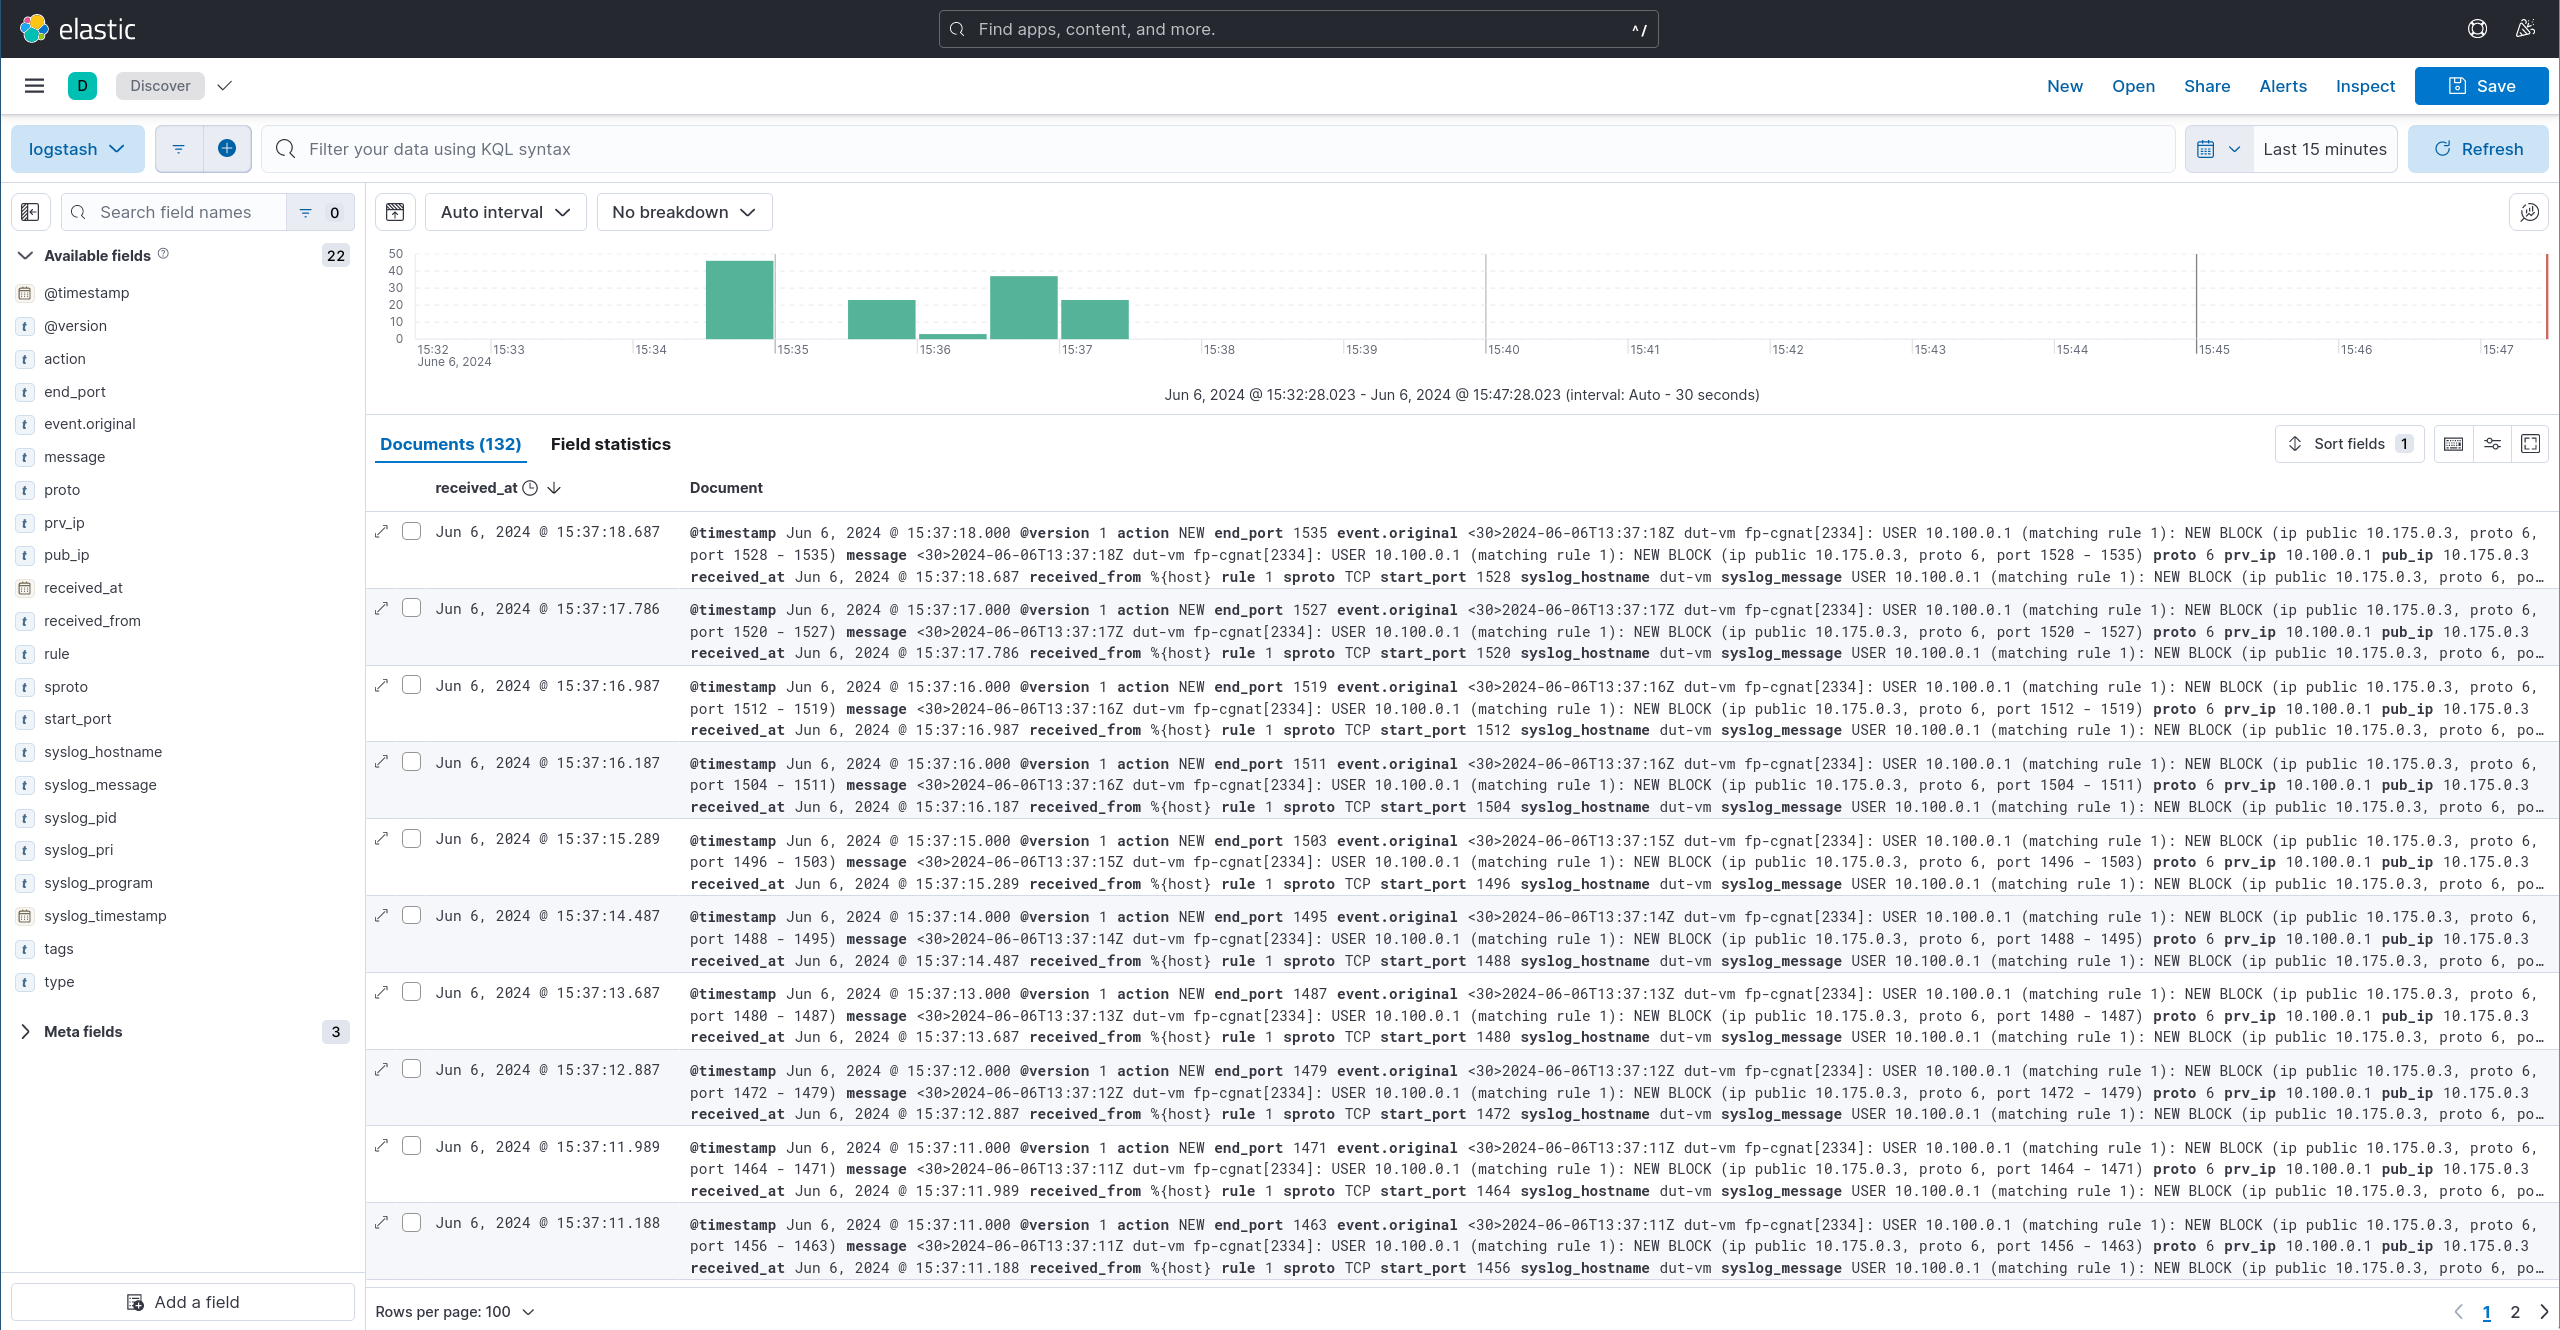
Click on Analytics, Discover in the left menu; some logs are now displayed in the Kibana dashboard.
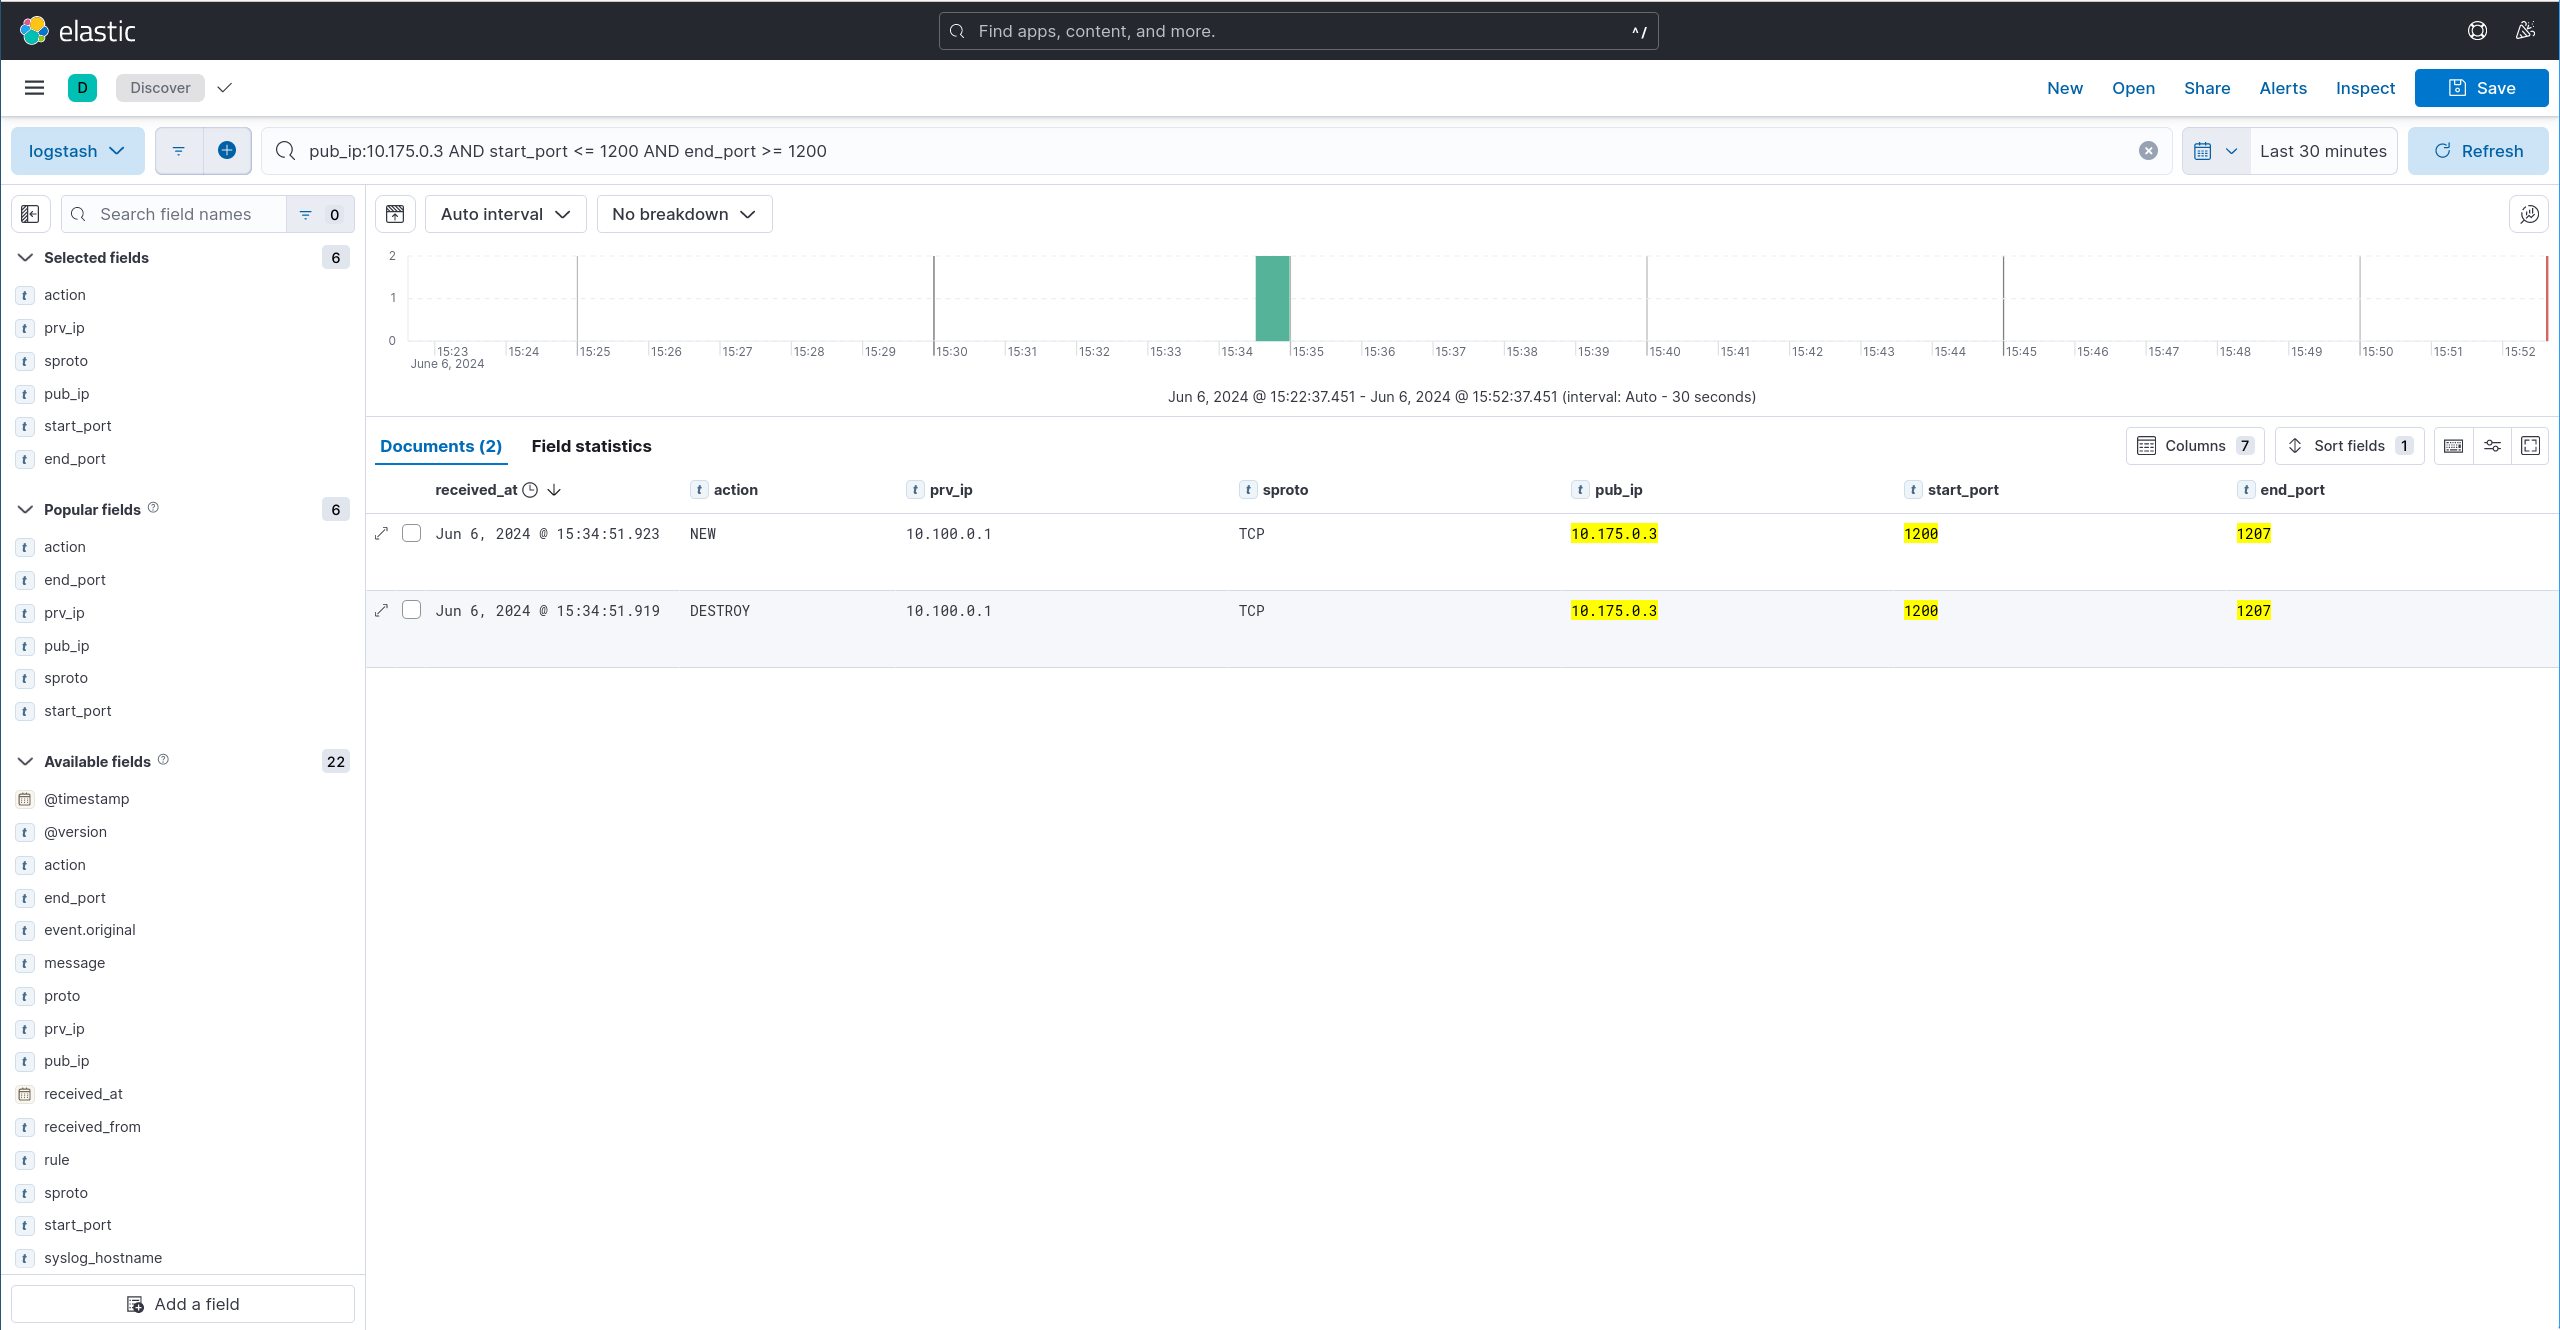
The final step is to clean the logs output. Add the following available fields: action, prv_ip, sproto, pub_ip, start_port, end_port.
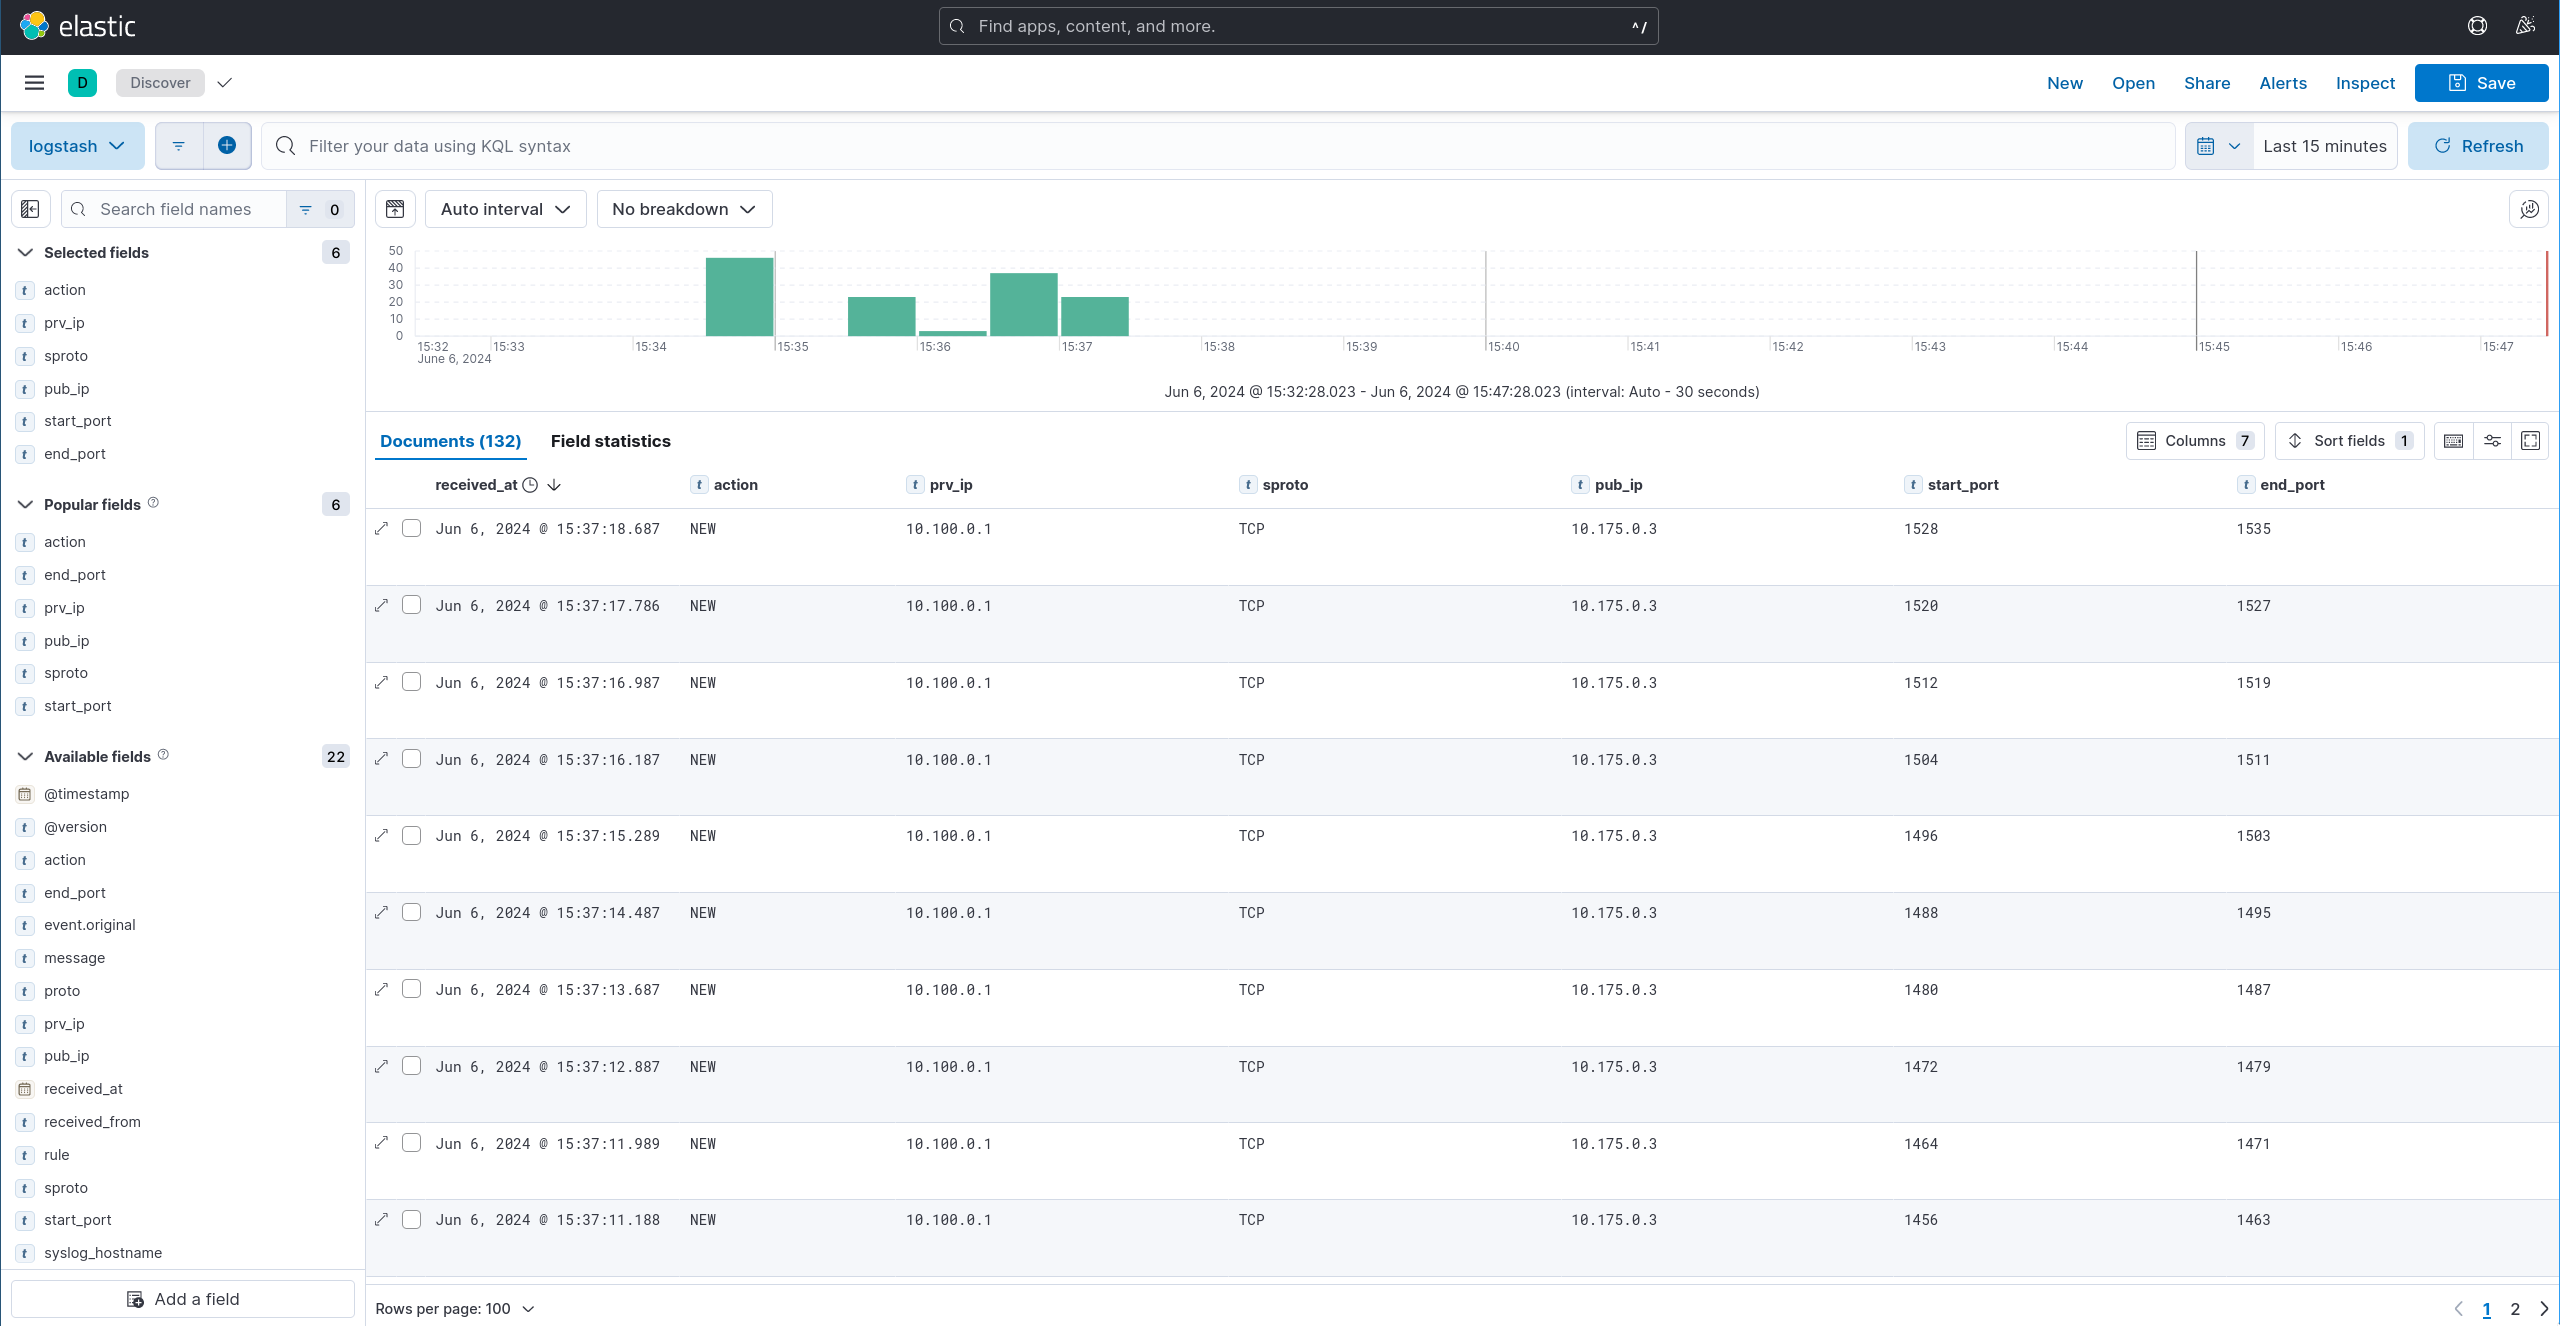
Search can now be used to filter the logs on a public IP and port, for example using “pub_ip:10.175.0.3 AND start_port <= 1200 AND end_port >= 1200” to search public IP 10.175.0.3 with start_port lower than 1200 or equal and end_port upper than 1200 or equal.