Use case: integration with InfluxDB / Grafana
In this section, we will explain how to integrate 6WIND monitoring module with
InfluxDB and Grafana using the Telegraf collector. This section assumes that
InfluxDB and Grafana have been installed on a A.B.C.D host, and that InfluxDB
is listening on its default 8086 port.
See also
On a freshly booted system, start monitoring
# monitoring.sh start
Starting Monitoring...
Monitoring successfully started
Check that the monitoring has been properly started
# monitoring.sh status
* kpid.service - KPI Daemon
   Loaded: loaded (/lib/systemd/system/kpid.service; disabled; vendor preset: enabled)
   Active: active (running) since Tue 2020-06-16 09:31:53 UTC; 3s ago
 Main PID: 3526 (kpid)
    Tasks: 1 (limit: 1088)
   CGroup: /system.slice/kpid.service
           `-3526 /usr/bin/python3 /usr/bin/kpid

* netopeer2-server.service - NETCONF Server
   Loaded: loaded (/lib/systemd/system/netopeer2-server.service; enabled; vendor preset: enabled)
   Active: active (running) since Mon 2020-06-16 09:31:52 UTC; 4s ago
 Main PID: 1067 (netopeer2-serve)
    Tasks: 7 (limit: 1088)
   CGroup: /system.slice/netopeer2-server.service
           `-1067 /usr/bin/netopeer2-server -U -g netconf -m 660
Copy the telegraf configuration file examples in telegraf configuration directory
# cp /usr/share/6WIND/telegraf/telegraf-input-kpi.conf /etc/telegraf/telegraf.d
# cp /usr/share/6WIND/telegraf/telegraf-output-influx.conf /etc/telegraf/telegraf.d
Edit the
/etc/telegraf/telegraf.d/telegraf-output-influx.conffile to put the A.B.C.D address, and the database information. If the database is not created on the InfluxDB server, it will be created by telegraf.[[outputs.influxdb]] urls = ["http://A.B.D.C:8086"] # Put the InfluxDB host address here database = "telegraf" # Put the InfluxDB database name here # username = "user" # Optional, put a user to connect to the InfluxDB database # password = "password" # Optional, put a password to connect to the InfluxDB database
Start and enable the telegraf service on boot:
# systemctl start telegraf
# systemctl enable telegraf
At this point, the InfluxDB telegraf database should start to be populated
with statistics coming from the 6WIND monitoring module.
Using the InfluxDB client (installed influxdb-client package), we can check that some records have been received.
# influx -host A.B.C.D -port 8086 -database 'telegraf'
Visit https://enterprise.influxdata.com to register for updates, InfluxDB server management, and monitoring.
Connected to http://127.0.0.1:8086 version 1.3.5
InfluxDB shell version: 1.0.2
> show measurements
name: measurements
------------------
fp-context-switch-stats
fp-cpu-usage
fp-drop-stats
fp-exception-queue-stats
fp-exceptions-stats
fp-ip-stats
fp-ip6-stats
fp-ipsec-stats
fp-ipsec6-stats
fp-l2-stats
linux-nic-eth-stats
linux-nic-traffic-stats
system-cpu-usage
system-numa-stats
system-memory
system-uptime
product-license
product-version

> SELECT * FROM linux-nic-traffic-stats LIMIT 4
name: linux-nic-traffic-stats
----------------------
time                      bytes-recv      bytes-sent      host    name    pkts-recv       pkts-sent
1510672561000000000       127617994       1495014321      router  mgmt0   1529466         1488143
1510672561000000000       41454147        41454147        router  lo      173106          173106
1510672571000000000       127619161       1495027098      router  mgmt0   1529483         1488159
1510672571000000000       41454147        41454147        router  lo      173106          173106

> SELECT IpForwDatagrams,IpInDelivers,IpInReceives FROM fp-ip-stats LIMIT 4
name: fp-ip-stats
----------------------
time            IpForwDatagrams    IpInDelivers    IpInReceives
1510748131000000000    0        0        0
1510748141000000000    0        0        0
1510748151000000000    0        0        0
1510748161000000000    0        0        0
Then, dashboards can be built by adding the InfluxDB database as data source and using the Query Editor to select metrics and tags in Grafana.
See also
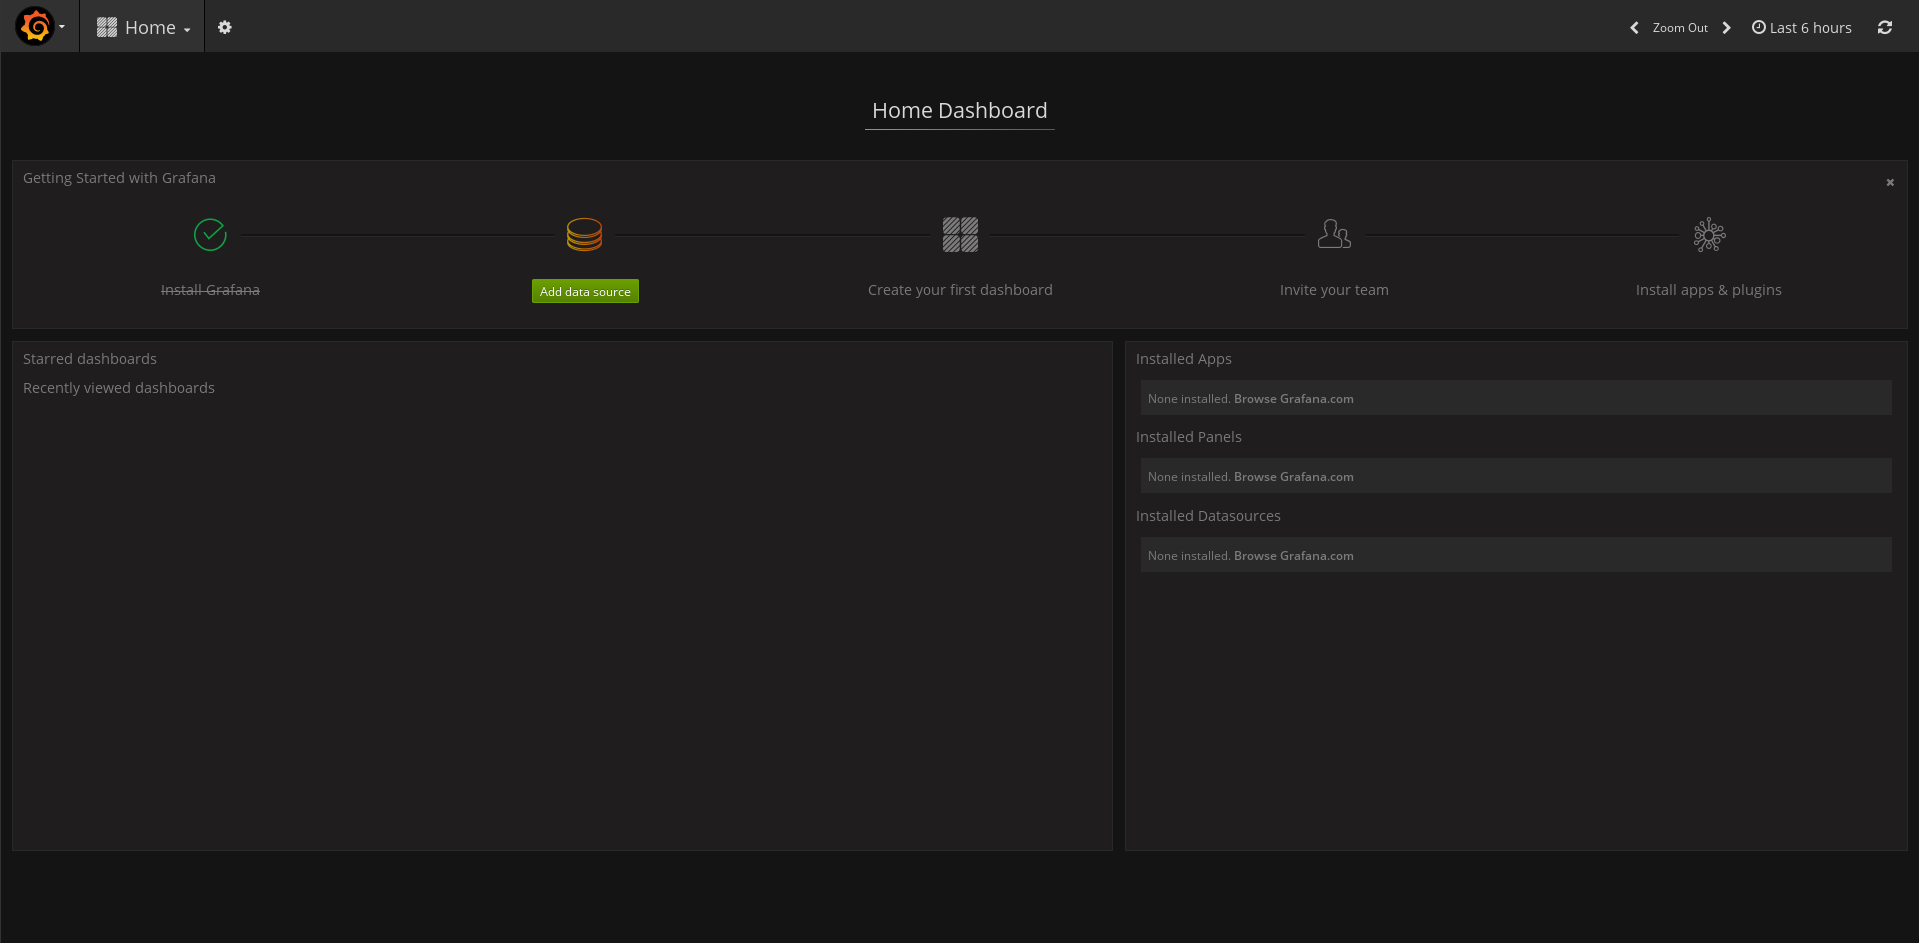
To do so, first login to grafana. The url is http://A.B.C.D:3000/, the default
user / password are admin / admin. Then, you should see a screen asking to
add a data source. Let’s add an InfluxDB data source. On the welcome screen,
click on Add data source:
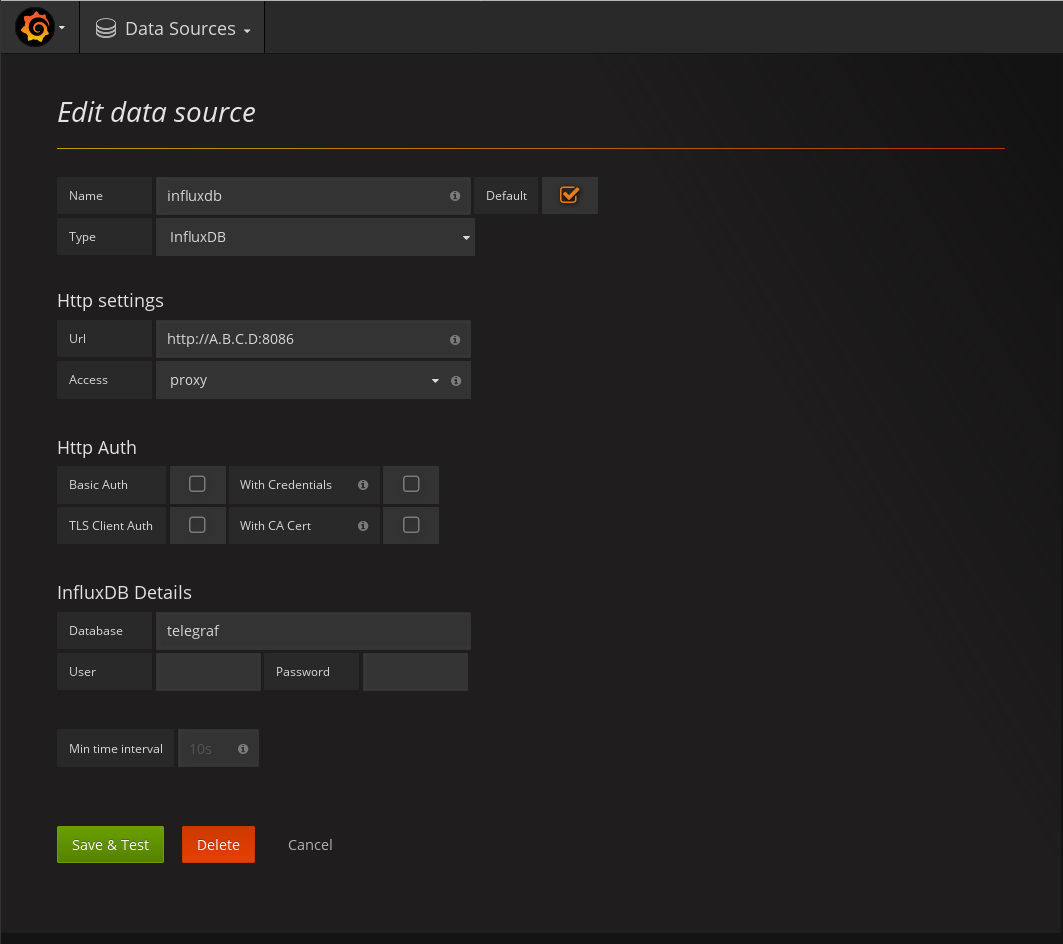
A new screen appears, configure a name for the data source, set InfluxDB as type, configure the url to point to your InfluxDB instance, and the database, so that it looks like this:
Once the data source is properly configured, this message should be displayed on the screen:

You are now ready to create your first dashboard. Let’s add a graph of the
system load. Go back to http://A.B.C.D:3000/ and click on Home on the left
corner of the page:
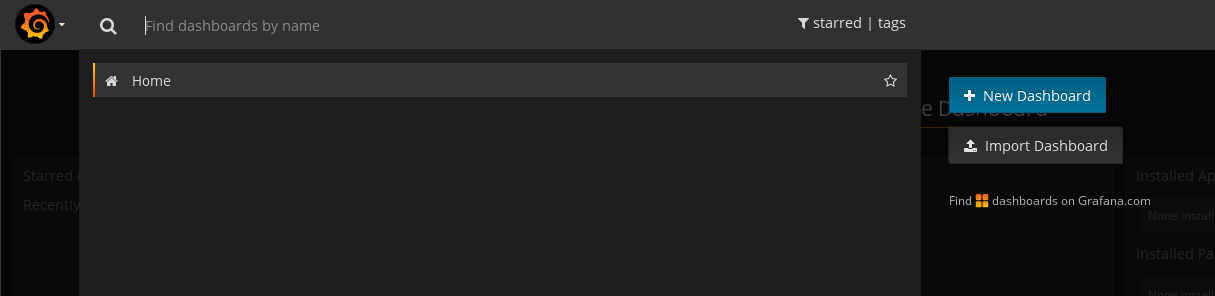
Click on + New Dashboard:
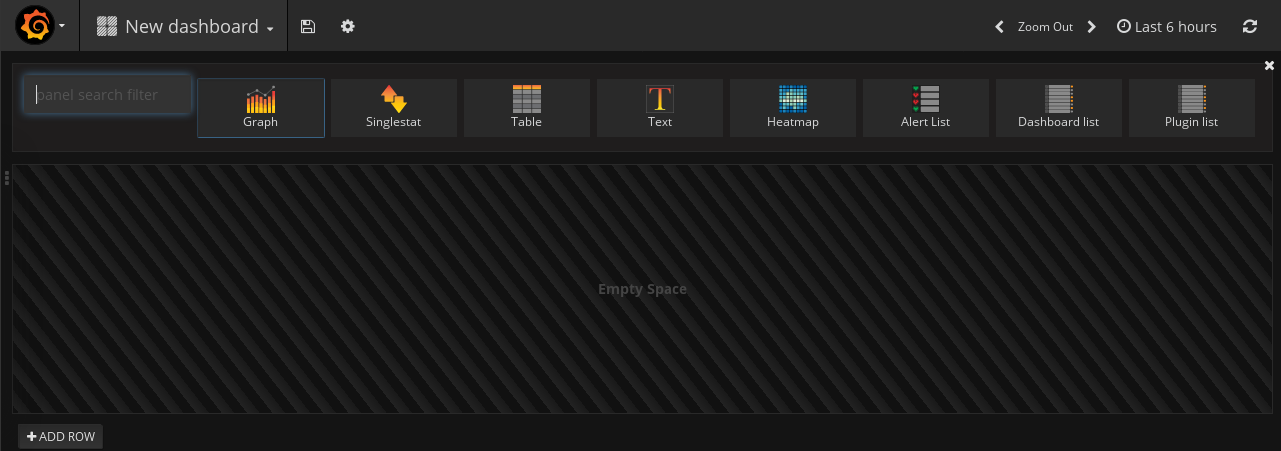
Click on graph to add a new one:
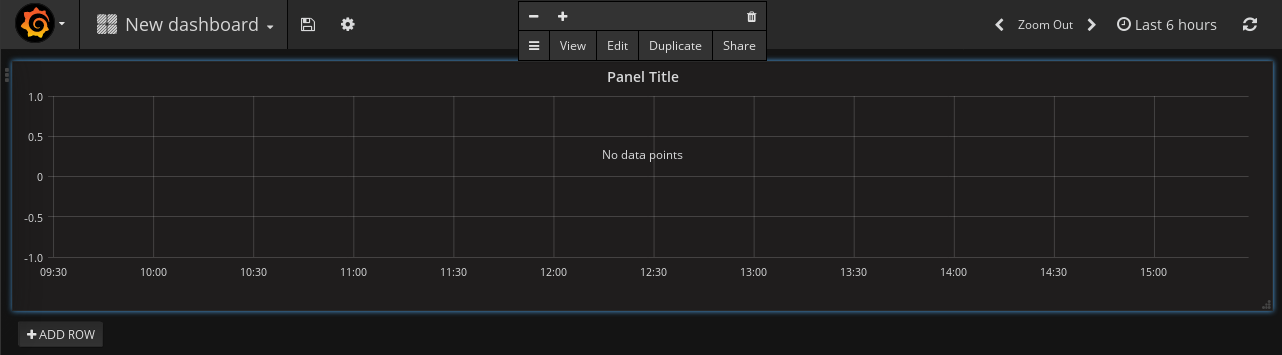
Click on Panel Title, a menu appears. Click on Edit:
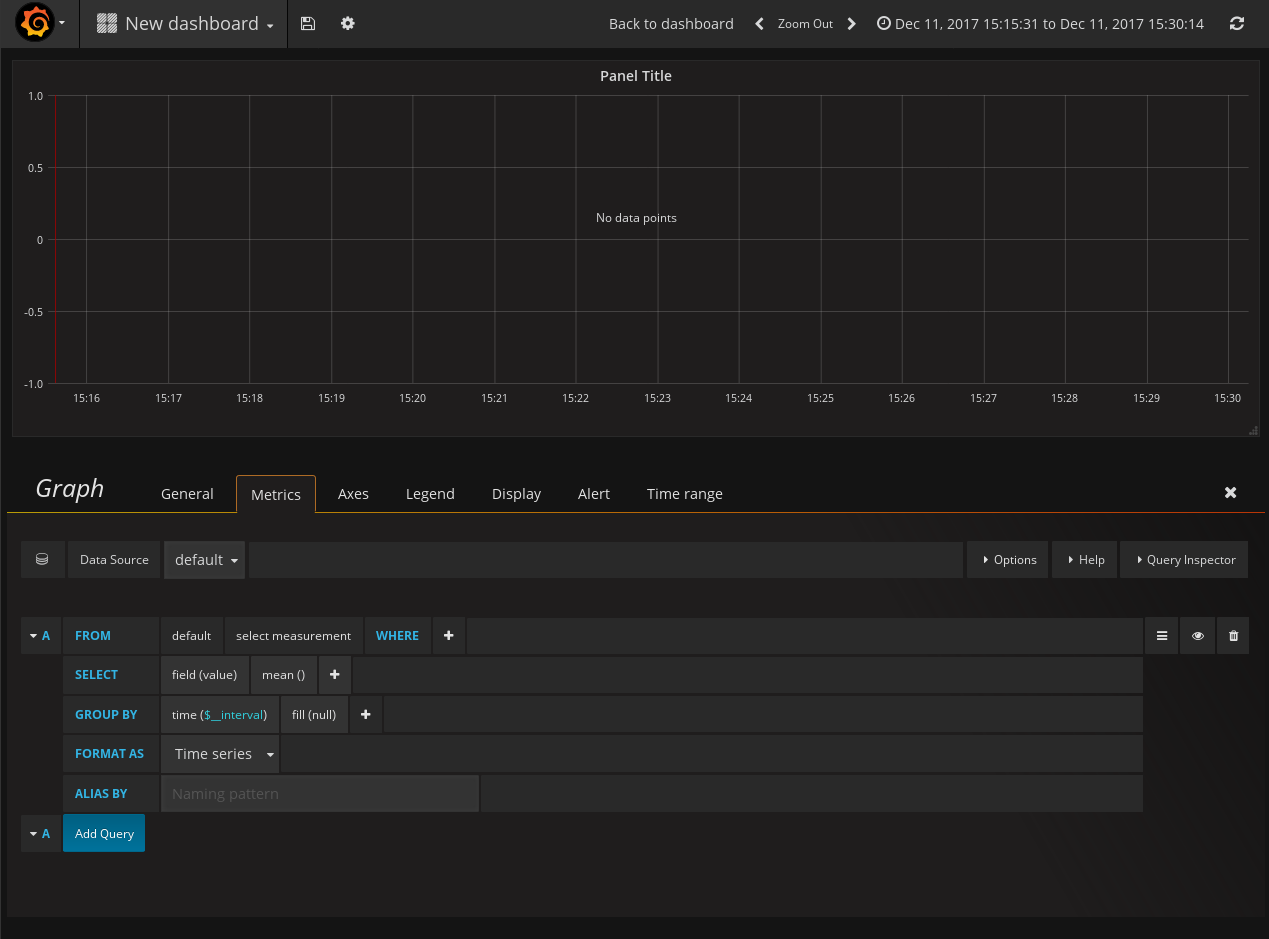
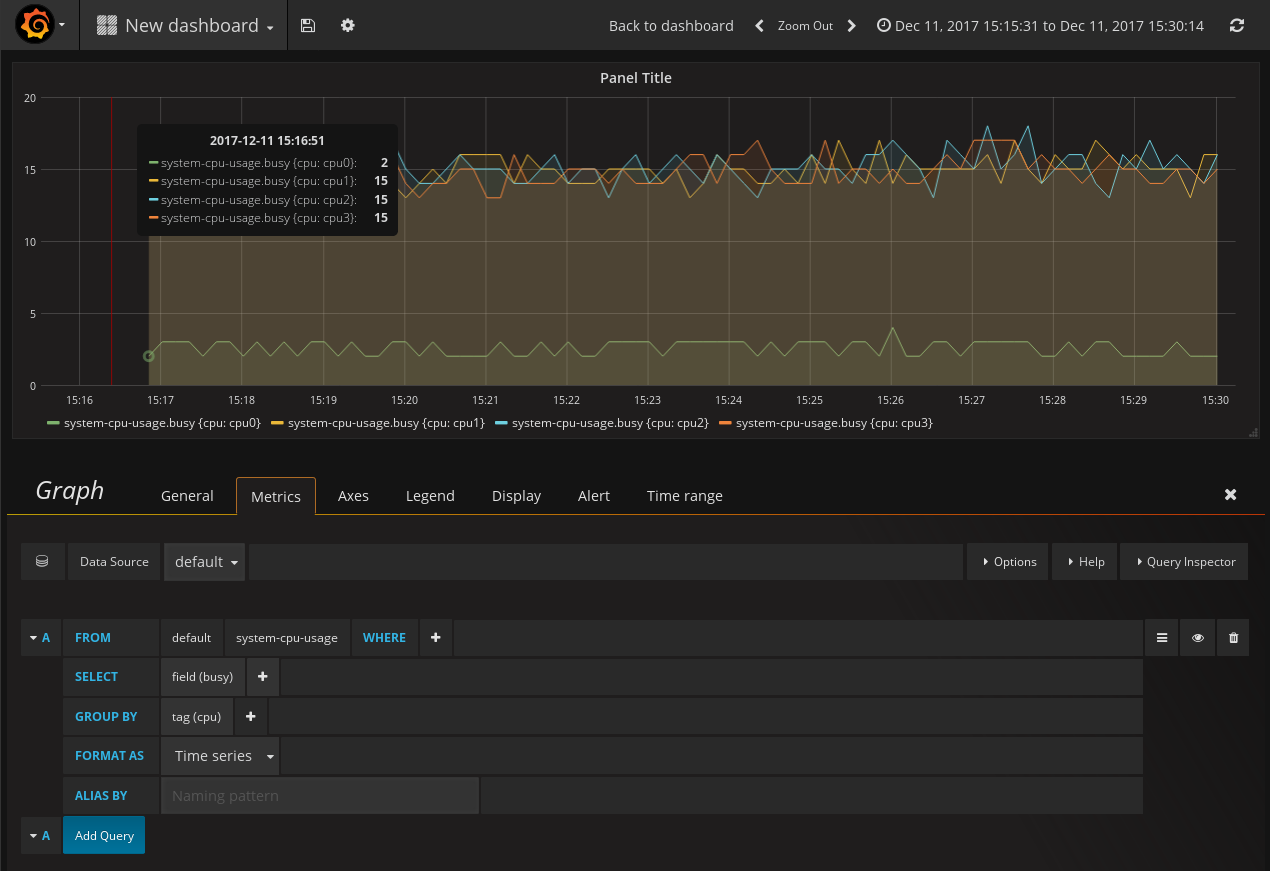
Click on select measurements on the From line, the list of available services
appears. Select system-cpu-usage. Click on mean() on the Select line and
then remove. Click on value in the field box on the Select line and
select busy. Click on time in the Group By line, and then Remove. Click on
+ on the Group By line and select tag(cpu). The following graph should
appear.
See also