4.4. System Information
4.4.1. CPU Pinning for VMs
For each virtual CPU, QEMU uses one pthread for actually running the VM and pthreads for management. For best performance, you need to make sure cores used to run fast path dataplane are only used for that.
To get the threads associated with each virtual CPU, use info cpus in QEMU
monitor console:
QEMU 2.3.0 monitor - type 'help' for more information
(qemu) info cpus
* CPU #0: pc=0xffffffff8104f596 (halted) thread_id=26773
  CPU #1: pc=0x00007faee19be9f9 thread_id=26774
  CPU #2: pc=0xffffffff8104f596 (halted) thread_id=26775
  CPU #3: pc=0x0000000000530233 thread_id=26776
To get all threads associated with your running VM (including management threads) and what CPU they are currently pinned on, call:
# taskset -ap <qemu_pid>
pid 26770's current affinity mask: f
pid 26771's current affinity mask: f
pid 26773's current affinity mask: f
pid 26774's current affinity mask: f
pid 26775's current affinity mask: f
pid 26776's current affinity mask: f
pid 27053's current affinity mask: f
By pinning our VM on a specific set of cores, we ensure less overload.
You may either run qemu with a specific set of cores when starting, using:
# taskset -c 0-1 <qemu command>
You may also pin a VM after it has been started, using the PID of its threads. For instance, to change the physical CPU on which to pin the virtual CPU #0, use:
# taskset -cp 0-1 26773
pid 26773's current affinity list: 0-3
pid 26773's new affinity list: 0,1
Note
Refer to the taskset manpage for specific options.
When using libvirt, you may use <cputune> with vcpupin to pin virtual
CPUs to physical ones. e.g.:
<vcpu cpuset='7-8,27-28'>4</vcpu>
<cputune>
  <vcpupin vcpu="0" cpuset="7"/>
  <vcpupin vcpu="1" cpuset="8"/>
  <vcpupin vcpu="2" cpuset="27"/>
  <vcpupin vcpu="3" cpuset="28"/>
</cputune>
Note
Refer to the libvirt Domain XML format documentation for further details.
We can look at htop results (after filtering results for this qemu instance)
to confirm what threads are actually used:
  PID USER       VIRT   RES   SHR S CPU% MEM%   TIME+  NLWP Command
26770 mazon     7032M 4067M  7092 S 200. 25.5  2h19:55    7 |- qemu-system-x86_64 -daemonize --enable-kvm -m 6G -cpu host -smp sockets=1,cores=4,threads=1 ...
27053 mazon     7032M 4067M  7092 S  0.0 25.5  0:01.13    7 |  |- qemu-system-x86_64 -daemonize --enable-kvm -m 6G -cpu host -smp sockets=1,cores=4,threads=1 ...
26776 mazon     7032M 4067M  7092 R 99.1 25.5  1h04:38    7 |  |- qemu-system-x86_64 -daemonize --enable-kvm -m 6G -cpu host -smp sockets=1,cores=4,threads=1 ...
26775 mazon     7032M 4067M  7092 S  0.9 25.5  2:48.21    7 |  |- qemu-system-x86_64 -daemonize --enable-kvm -m 6G -cpu host -smp sockets=1,cores=4,threads=1 ...
26774 mazon     7032M 4067M  7092 R 99.1 25.5  1h09:42    7 |  |- qemu-system-x86_64 -daemonize --enable-kvm -m 6G -cpu host -smp sockets=1,cores=4,threads=1 ...
26773 mazon     7032M 4067M  7092 S  0.0 25.5  2:23.03    7 |  |- qemu-system-x86_64 -daemonize --enable-kvm -m 6G -cpu host -smp sockets=1,cores=4,threads=1 ...
26771 mazon     7032M 4067M  7092 S  0.0 25.5  0:00.00    7 |  |- qemu-system-x86_64 -daemonize --enable-kvm -m 6G -cpu host -smp sockets=1,cores=4,threads=1 ...
You may even change CPU affinity by typing a when on a specific PID line
in htop.
Similarly, you can get threads PID by looking in /proc/<pid>/task/,
e.g.:
# ls /proc/26773/task
26770/  26771/  26773/  26774/  26775/  26776/  27053/
4.4.2. ethtool
The ethtool program is used to display and set options related to network
drivers (for those that support it).
To display the statistics for a given port, use ethtool -S <port>:
# ethtool -S eth1

NIC statistics:
     rx_good_packets: 261064663
     tx_good_packets: 256512062
     rx_good_bytes: 15663879780
     tx_good_bytes: 15390725600
     rx_missed_errors: 0
     rx_errors: 36554346
     tx_errors: 0
     rx_mbuf_allocation_errors: 0
     rx_q0_packets: 32632951
     rx_q0_bytes: 1957977060
     rx_q0_errors: 0
     ...
     tx_q0_packets: 128251039
     tx_q0_bytes: 7695062334
     ...
     rx_total_packets: 297619011
     rx_total_bytes: 17857140760
     tx_total_packets: 256512062
     tx_size_64_packets: 256512046
     ...
The most important stats to look at are the {r,t}x_good_{packets,bytes} and
errors.
They indicate globally how well the port is handling packets.
There is also per queue statistics that might be interesting in case of multiqueue. It’s better to have packets transmitted on as many different queues as possible, but it depends on various factors, such as the IP addresses and UDP / TCP ports.
The drop statistics provide useful information about why packets are dropped.
For instance, the rx_missed_errors counter represents the number of packets
dropped because the CPU was not fast enough to dequeue them. A non-zero value
for rx_mbuf_allocation_errors shows that there is not enough mbuf structure configured
in the fast path.
Note
Statistics field names may vary considering the driver.
ethtool can be used to check whether offload is enabled, using the following:
# ethtool -k <port>
Features for <port>:
rx-checksumming: off [fixed]
tx-checksumming: off
        tx-checksum-ipv4: off [fixed]
        tx-checksum-ip-generic: off [fixed]
        tx-checksum-ipv6: off [fixed]
        tx-checksum-fcoe-crc: off [fixed]
        tx-checksum-sctp: off [fixed]
scatter-gather: off
        tx-scatter-gather: off [fixed]
        tx-scatter-gather-fraglist: off [fixed]
tcp-segmentation-offload: off
        tx-tcp-segmentation: off [fixed]
        tx-tcp-ecn-segmentation: off [fixed]
        tx-tcp6-segmentation: off [fixed]
udp-fragmentation-offload: off [fixed]
generic-segmentation-offload: off [requested on]
generic-receive-offload: on
large-receive-offload: off [fixed]
rx-vlan-offload: off [fixed]
tx-vlan-offload: off [fixed]
ntuple-filters: off [fixed]
receive-hashing: off [fixed]
highdma: off [fixed]
rx-vlan-filter: off [fixed]
vlan-challenged: off [fixed]
tx-lockless: off [fixed]
netns-local: off [fixed]
tx-gso-robust: off [fixed]
tx-fcoe-segmentation: off [fixed]
tx-gre-segmentation: off [fixed]
tx-ipip-segmentation: off [fixed]
tx-sit-segmentation: off [fixed]
tx-udp_tnl-segmentation: off [fixed]
tx-mpls-segmentation: off [fixed]
fcoe-mtu: off [fixed]
tx-nocache-copy: off
loopback: off [fixed]
rx-fcs: off [fixed]
rx-all: off [fixed]
tx-vlan-stag-hw-insert: off [fixed]
rx-vlan-stag-hw-parse: off [fixed]
rx-vlan-stag-filter: off [fixed]
busy-poll: off [fixed]
If you want to enable TSO (which should provide you with better performance for TCP, as the hardware will handle the segmentation), use:
# ethtool -K eth1 tso on
Note
You can get various error messages when trying to change hardware parameters.
For instance, Cannot change tcp-segmentation-offload may appear if the
driver does not support to dynamically change TSO offload.
Note
Refer to the ethtool manpage for specific options.
4.4.3. lspci
The lspci command is useful to display information about PCI buses. In most
cases, we look for “Ethernet” devices.
Use lspci to get basic information on all connected devices:
# lspci
00:00.0 Host bridge: Intel Corporation 440FX - 82441FX PMC [Natoma] (rev 02)
00:01.0 ISA bridge: Intel Corporation 82371SB PIIX3 ISA [Natoma/Triton II]
00:01.1 IDE interface: Intel Corporation 82371SB PIIX3 IDE [Natoma/Triton II]
00:01.3 Bridge: Intel Corporation 82371AB/EB/MB PIIX4 ACPI (rev 03)
00:02.0 VGA compatible controller: Device 1234:1111 (rev 02)
00:03.0 Ethernet controller: Intel Corporation 82540EM Gigabit Ethernet Controller (rev 03)
To display the driver handling devices, use:
# lspci -k
00:00.0 Host bridge: Intel Corporation 440FX - 82441FX PMC [Natoma] (rev 02)
        Subsystem: Red Hat, Inc Qemu virtual machine
00:01.0 ISA bridge: Intel Corporation 82371SB PIIX3 ISA [Natoma/Triton II]
        Subsystem: Red Hat, Inc Qemu virtual machine
00:01.1 IDE interface: Intel Corporation 82371SB PIIX3 IDE [Natoma/Triton II]
        Subsystem: Red Hat, Inc Qemu virtual machine
        Kernel driver in use: ata_piix
00:01.3 Bridge: Intel Corporation 82371AB/EB/MB PIIX4 ACPI (rev 03)
        Subsystem: Red Hat, Inc Qemu virtual machine
00:02.0 VGA compatible controller: Device 1234:1111 (rev 02)
        Subsystem: Red Hat, Inc Device 1100
00:03.0 Ethernet controller: Intel Corporation 82540EM Gigabit Ethernet Controller (rev 03)
        Subsystem: Red Hat, Inc QEMU Virtual Machine
        Kernel driver in use: igb_uio
Note
Refer to the lspci manpage for specific options.
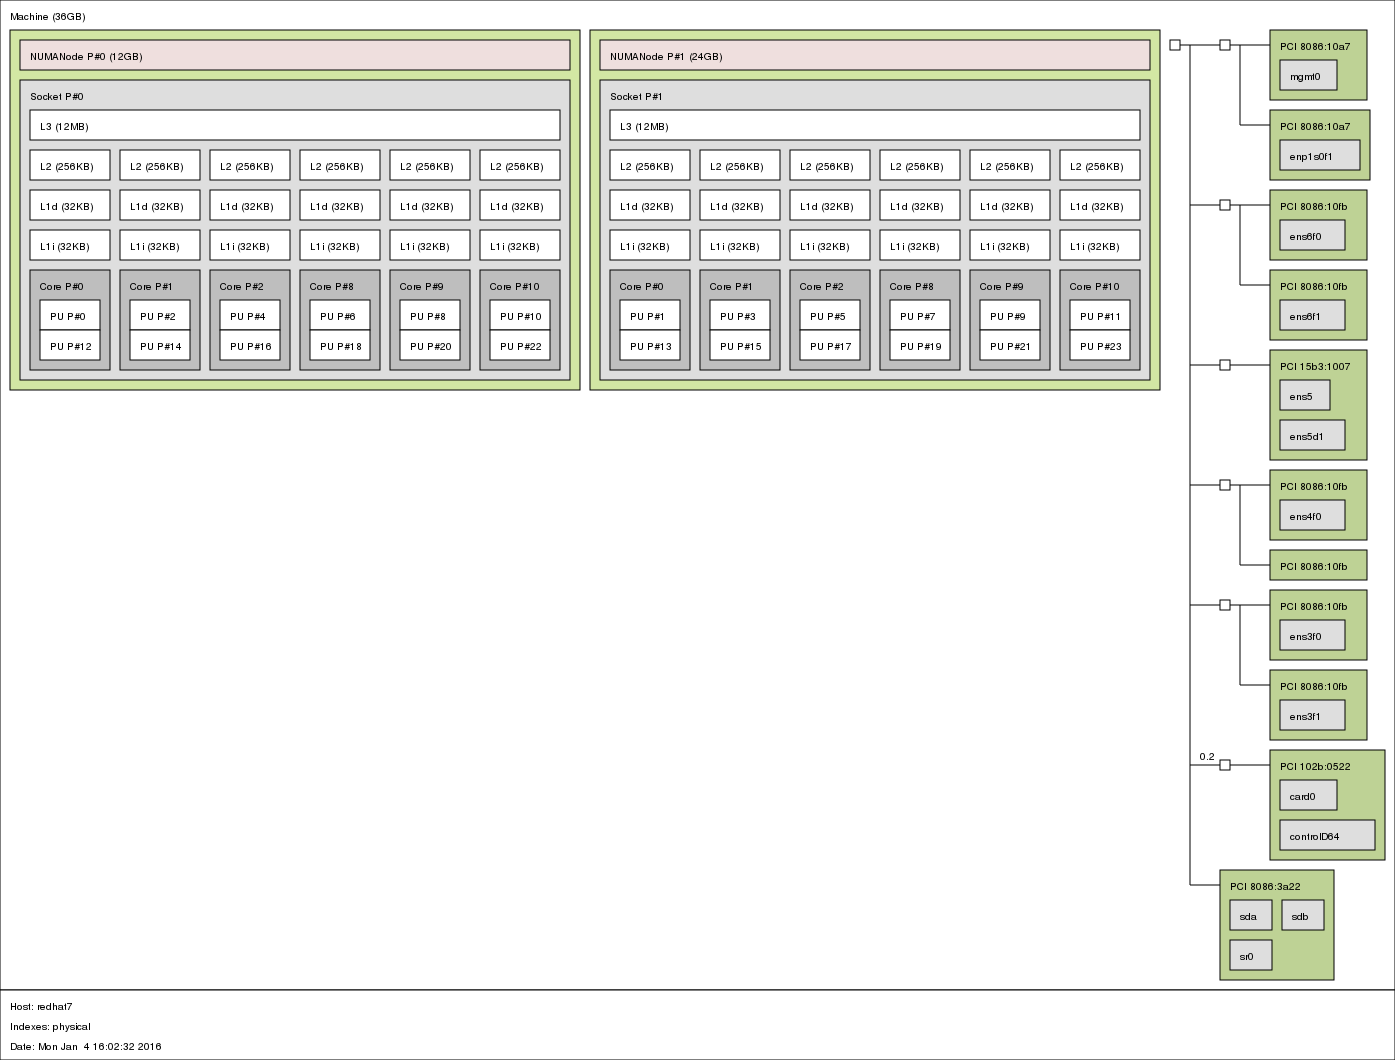
4.4.4. lstopo
lstopo provides a global view of the system’s topology. It details what
machines contain what nodes, containing sockets, containing cores, containing
processor units.
The following command presents a graphical representation of a big machine’s topology:
# lstopo --of png > lstopo_output.png
You can use the following command to get a textual representation:
# lstopo --of txt
4.4.5. meminfo
The file /proc/meminfo presents a memory status summary. You can also look at
memory by node through /sys/devices/system/node/node<node_id>/meminfo.
On a VM with 1GB of RAM running redhat-7, we have this:
# cat /proc/meminfo
MemTotal:        1016548 kB
MemFree:          107716 kB
MemAvailable:     735736 kB
Buffers:           83244 kB
Cached:           626528 kB
SwapCached:            0 kB
Active:           400416 kB
Inactive:         352892 kB
Active(anon):      49808 kB
Inactive(anon):    13304 kB
Active(file):     350608 kB
Inactive(file):   339588 kB
Unevictable:           0 kB
Mlocked:               0 kB
SwapTotal:             0 kB
SwapFree:              0 kB
Dirty:                 0 kB
Writeback:             0 kB
AnonPages:         43652 kB
Mapped:             9500 kB
Shmem:             19572 kB
Slab:             130972 kB
SReclaimable:     100896 kB
SUnreclaim:        30076 kB
KernelStack:        1888 kB
PageTables:         2692 kB
NFS_Unstable:          0 kB
Bounce:                0 kB
WritebackTmp:          0 kB
CommitLimit:      507248 kB
Committed_AS:     214004 kB
VmallocTotal:   34359738367 kB
VmallocUsed:        4412 kB
VmallocChunk:   34359730912 kB
HardwareCorrupted:     0 kB
AnonHugePages:      4096 kB
HugePages_Total:       1
HugePages_Free:        0
HugePages_Rsvd:        0
HugePages_Surp:        0
Hugepagesize:       2048 kB
DirectMap4k:       79744 kB
DirectMap2M:      968704 kB
Note
The kernel documentation provides details regarding meminfo here. For
details regarding the HugePages fields, look there.
The most interesting fields in our case are:
MemTotalshould be the same as the “total” memory displayed on top lines when running
topMemFreeshould be the same as the “free” memory displayed on top lines when running
topMemAvailableestimate of how much memory is available for starting new applications, without swapping
HugePages_Totalsize of the pool of huge pages
HugePages_Freenumber of huge pages in the pool that are not yet allocated
HugePages_Rsvdnumber of huge pages for which a commitment to allocate from the pool has been made, but no allocation has yet been made
4.4.6. numastat
This tool shows per-NUMA-node memory statistics for processes and the operating system.
Without argument, it displays per-node NUMA hit and miss system statistics from
the kernel memory allocator. A high value in other_node means that there are
cross-NUMA memory transfers, which impacts performance. This information is
dynamic and can be monitored with the watch command.
# numastat
                           node0           node1
numa_hit               589246433       556912817
numa_miss                      0               0
numa_foreign                   0               0
interleave_hit             11616           17088
local_node             589229023       556900289
other_node                 17410           12528
When a PID or a pattern is passed, it shows per-node memory allocation information for the specified process (including all its pthreads). The hugepages correspond to the DPDK memory, and the private area mainly corresponds to the shared memories.
# numastat fp-rte
Per-node process memory usage (in MBs) for PID 2176 (fp-rte:8)
                           Node 0          Node 1           Total
                  --------------- --------------- ---------------
Huge                       842.00          842.00         1684.00
Heap                         0.41            0.00            0.41
Stack                        0.03            0.00            0.03
Private                   1004.35           24.27         1028.62
----------------  --------------- --------------- ---------------
Total                     1846.79          866.27         2713.06
Note
Refer to the numa manpage for details.