KPIs
6WIND KPI monitoring provides the ability to monitor and export Virtual Service Router KPIs. For this, the metrics should first be collected with the internal KPI daemon to the be sent via the Telegraf agent to external monitoring tools via its output plugins.
Note
These metrics can be exported using the gNMI service as-well.
KPI collection
To setup the KPI daemon to collect metrics, configure:
vsr running config# / vrf main kpi telegraf metrics
If no metrics are specified, by default, only the most common KPIs are
collected (some will be marked enabled true and some false) with a default
period of collection for each that is estimated adequate. For example, the
product-version does not need to be collected more frequently every 120
seconds compared to the alarm-summary that is collected every 10 seconds.
vsr> show state / vrf main kpi telegraf metrics
metrics
    enabled true
    template default
    metric alarm-summary enabled true period 10
    metric bng-ipoe-server-stats enabled false period 10
    metric bng-pppoe-server-stats enabled false period 10
    metric ha-fp-conntrack-stats enabled false period 60
    metric fp-bridge-stats enabled false period 60
    metric fp-cg-nat-stats enabled false period 60
    metric fp-conntrack-stats enabled false period 60
    metric fp-event-stats enabled false period 60
    metric fp-cp-protect-stats enabled false period 60
    metric fp-cpu-usage enabled true period 10
    metric fp-ddos-stats enabled false period 10
    metric fp-exceptions-stats enabled false period 60
    metric fp-filling enabled true period 10
    metric fp-firewall-stats enabled false period 60
    metric fp-global-stats enabled false period 60
    metric fp-gre-stats enabled false period 60
    metric fp-gro-stats enabled false period 60
    metric fp-ip-stats enabled false period 60
    metric fp-ip6-stats enabled false period 60
    metric fp-ipsec-stats enabled false period 60
    metric fp-ipsec6-stats enabled false period 60
    metric fp-ports-stats enabled false period 60
    metric fp-status enabled true period 10
    metric fp-vlan-stats enabled false period 60
    metric fp-vxlan-stats enabled false period 60
    metric network-nic-eth-stats enabled false period 60
    metric network-nic-hw-info enabled true period 60
    metric network-nic-traffic-stats enabled true period 10
    metric network-twamp-stats enabled false period 60
    metric product-license enabled true period 10
    metric product-version enabled true period 120
    metric system-cpu-times enabled true period 10
    metric system-cpu-usage enabled true period 10
    metric system-disk-usage enabled true period 60
    metric system-memory enabled true period 60
    metric system-numa-stats enabled false period 60
    metric system-power enabled false period 10
    metric system-processes enabled true period 10
    metric system-soft-interrupts-stats enabled false period 60
    metric system-uptime enabled true period 10
    metric system-user-count enabled true period 10
    metric system-users enabled true period 10
    ..
To enable a specific metric, configure it enabled true:
vsr running config# / vrf main kpi telegraf metrics metric fp-bridge-stats enabled true
vsr> show state / vrf main kpi telegraf metrics metric fp-bridge-stats
metric fp-bridge-stats enabled true period 60
To change the period of collection of a specific metric, configure:
vsr running config# / vrf main kpi telegraf metrics metric fp-bridge-stats enabled true period 10
vsr> show state / vrf main kpi telegraf metrics metric fp-bridge-stats
metric fp-bridge-stats enabled true period 10
To collect all the licensed metrics, configure the template all option:
vsr running config# / vrf main kpi telegraf metrics template all
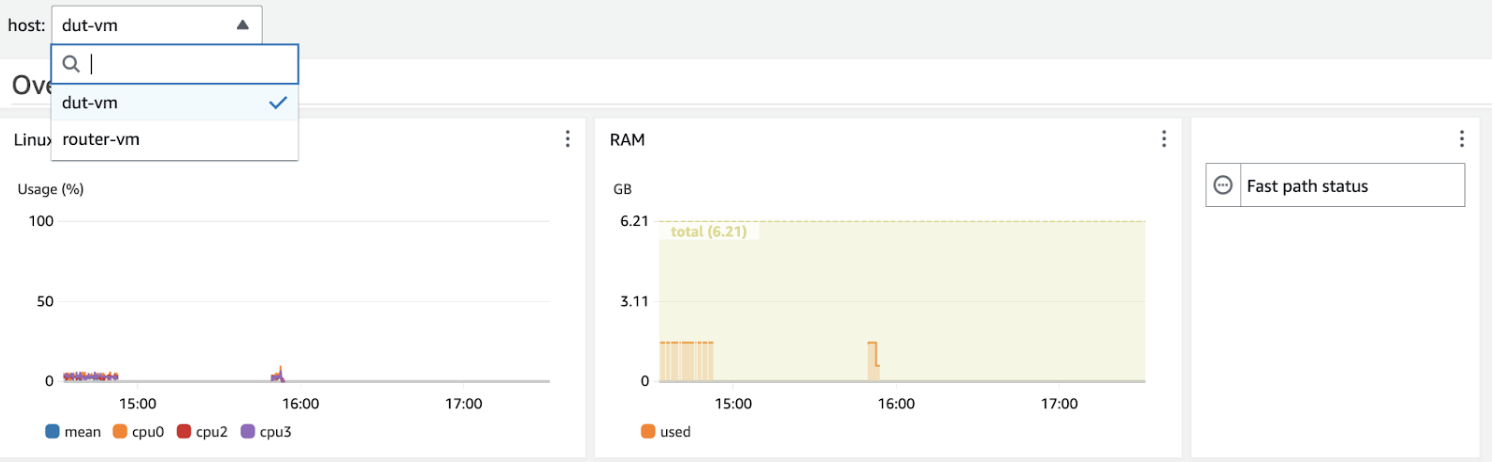
By default, the network interfaces whose KPIs are collected server are the fast path ports. This can be changed be specifying the list of interfaces:
vsr running config# / vrf main kpi telegraf metrics monitored-interface name vlan0 vrf main
vsr running config# / vrf main kpi telegraf metrics monitored-interface name vlan1 vrf main
vsr running config# / vrf main kpi telegraf metrics monitored-interface name mgmt0 vrf mgmt
Note
If a list of interfaces is specified, the default will not apply anymore and the fast path ports will have to be added manually to the kpi interface list to be exported.
If several devices are monitored, it can be useful to add a cluster id, that will be used in the cluster dashboard to aggregate the devices with the same cluster id. The following command will set the cluster value to primary:
vsr running config# / vrf main kpi telegraf tag cluster value primary
To display the state:
vsr> show state / vrf main kpi telegraf metrics
metrics
    enabled true
    monitored-interface vrf main name vlan0
    monitored-interface vrf main name vlan1
    monitored-interface vrf mgmt name mgmt0
    template all
    metric alarm-summary enabled true period 10
    metric bng-ipoe-server-stats enabled true period 10
    metric bng-pppoe-server-stats enabled true period 10
    metric ha-fp-conntrack-stats enabled true period 60
    metric fp-bridge-stats enabled true period 10
    metric fp-cg-nat-stats enabled true period 60
    metric fp-conntrack-stats enabled true period 60
    metric fp-event-stats enabled true period 60
    metric fp-cp-protect-stats enabled true period 60
    metric fp-cpu-usage enabled true period 10
    metric fp-ddos-stats enabled true period 10
    metric fp-exceptions-stats enabled true period 60
    metric fp-filling enabled true period 10
    metric fp-firewall-stats enabled true period 60
    metric fp-global-stats enabled true period 60
    metric fp-gre-stats enabled true period 60
    metric fp-gro-stats enabled true period 60
    metric fp-ip-stats enabled true period 60
    metric fp-ip6-stats enabled true period 60
    metric fp-ipsec-stats enabled true period 60
    metric fp-ipsec6-stats enabled true period 60
    metric fp-ports-stats enabled true period 60
    metric fp-status enabled true period 10
    metric fp-vlan-stats enabled true period 60
    metric fp-vxlan-stats enabled true period 60
    metric network-nic-eth-stats enabled true period 60
    metric network-nic-hw-info enabled true period 60
    metric network-nic-traffic-stats enabled true period 10
    metric network-twamp-stats enabled true period 60
    metric product-license enabled true period 10
    metric product-version enabled true period 120
    metric system-cpu-times enabled true period 10
    metric system-cpu-usage enabled true period 10
    metric system-disk-usage enabled true period 60
    metric system-memory enabled true period 60
    metric system-numa-stats enabled true period 60
    metric system-power enabled true period 10
    metric system-processes enabled true period 10
    metric system-soft-interrupts-stats enabled true period 60
    metric system-uptime enabled true period 10
    metric system-user-count enabled true period 10
    metric system-users enabled true period 10
    ..
The same configuration can be made using this NETCONF XML configuration:
vsr> show config xml absolute / vrf main kpi telegraf metrics
<config xmlns="urn:6wind:vrouter">
  <vrf>
    <name>main</name>
    <kpi xmlns="urn:6wind:vrouter/kpi">
      <telegraf xmlns="urn:6wind:vrouter/kpi/telegraf">
        <metrics>
          <enabled>true</enabled>
          <monitored-interface>
            <vrf>main</vrf>
            <name>vlan0</name>
          </monitored-interface>
          <monitored-interface>
            <vrf>main</vrf>
            <name>vlan1</name>
          </monitored-interface>
          <monitored-interface>
            <vrf>mgmt</vrf>
            <name>mgmt0</name>
          </monitored-interface>
          <template>all</template>
          <metric>
            <name xmlns:vrouter-fast-path-statistics="urn:6wind:vrouter/fast-path-statistics">vrouter-fast-path-statistics:fp-bridge-stats</name>
            <enabled>true</enabled>
            <period>10</period>
          </metric>
        </metrics>
      </telegraf>
    </kpi>
  </vrf>
</config>
Telegraf plugins
When the KPIs are collected, Telegraf can be configured to export metrics to
different monitoring tools. Here is the list of the supported tools:
Amazon CloudWatchApache KafkaElasticsearchGraphiteInfluxDBInfluxDBv2New RelicPrometheus
The recommended setup to export the collected KPIs is to setup InfluxDB Telegraf plugin on the Virtual Service Router and to have an external machine running InfluxDB plugged into Grafana.
Amazon CloudWatch
Amazon CloudWatch is a service provided by AWS that allows to monitor KPIs on the Cloud via the AWS console. This service offers dashboarding solutions populated with exported KPIs values.
To configure the export of the KPIs to Amazon CloudWatch, mention the AWS
region and define a namespace within this region where to store the data.
vsr> edit running
vsr running config# vrf main kpi telegraf amazon-cloudwatch-output region us-east-1 namespace InfluxData/Telegraf
vsr running amazon-cloudwatch-output namespace InfluxData/Telegraf region us-east-1#!
Then, allow Telegraf to authenticate to AWS. Choose one of the following strategies:
Explicit credentialsSTS(Security Token Service)EC2 authorized
Explicit credentials
Configure the access_key and secret_key of an account that has the rights to
use the PutMetricData
API CloudWatch endpoint:
vsr running amazon-cloudwatch-output namespace InfluxData/Telegraf region us-east-1#! authentication explicit-credentials
vsr running explicit-credentials#! access-key access-key-example
vsr running explicit-credentials#! secret-key secret-key-example
vsr running explicit-credentials# commit
STS (Security Token Service)
Configure the arn_role to which the proper policies have been added:
the STS AssumeRole
a policy to access CloudWatch API, at minimum the
PutMetricDataendpoint
vsr running amazon-cloudwatch-output namespace InfluxData/Telegraf region us-east-1#! authentication sts-credentials
vsr running sts-credentials#! arn-role arn:aws:iam::123456789012:role/my-role
vsr running sts-credentials# commit
EC2 authorized
If the Virtual Service Router is running on an AWS EC2 instance that has been granted
the right to use the CloudWatch API by its admin, configure the ec2-authorized
option.
vsr running amazon-cloudwatch-output namespace InfluxData/Telegraf region us-east-1#! authentication ec2-authorized
vsr running ec2-authorized# commit
As soon as the connection is established, the exported KPIs are visible in
the Amazon CloudWatch console.
Under Metrics, select the configured region:
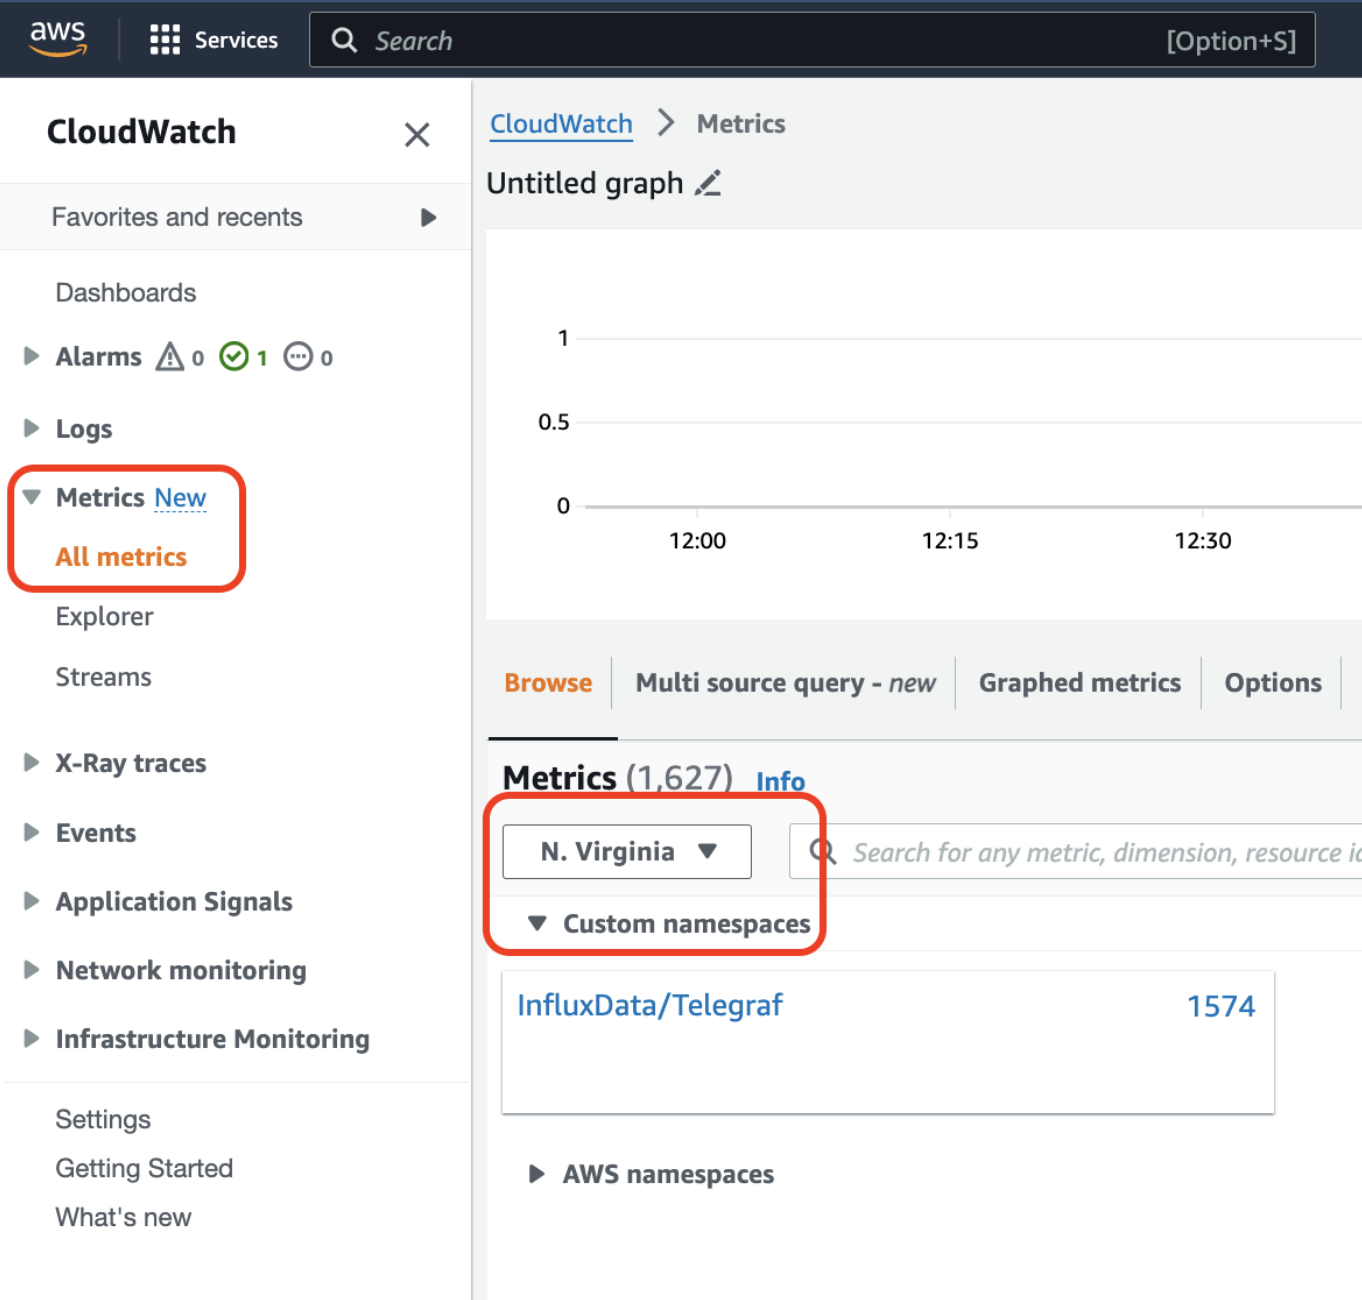
Dashboards can also be made with the exported metrics in the Amazon CloudWatch console:
Apache Kafka
Apache Kafka is a distributed streaming platform
that allows to monitor metrics. The instance of Telegraf that sends the metrics
to Apache Kafka is called the producer. From the Apache Kafka server, a
consumer can read the sent metrics.
After collecting the metrics on the Virtual Service Router, to configure the export of the
KPIs to Apache Kafka, configure the broker at the IP address and port
(usually the port 9092) where the Kafka server is running:
vsr> edit running
vsr running config# vrf main kpi telegraf kafka-output broker <kafka-server-ip>:9092
The connection to Apache Kafka has been tested with the following Docker image: confluentinc/cp-kafka:7.3.5.
An example of Docker configuration of an Apache Kafka server can be done with a docker-compose file on an external machine as followed:
version: '3.8'
services:
   zookeeper:
      image: confluentinc/cp-zookeeper:7.3.5
      container_name: zookeeper
      environment:
         ZOOKEEPER_CLIENT_PORT: 2181
         ZOOKEEPER_TICK_TIME: 2000
      ports:
         - 2181:2181
      networks:
         - kafka-network

   kafka:
      image: confluentinc/cp-kafka:7.3.5
      container_name: kafka
      ports:
         - 9092:9092
      volumes:
         - /root/kafka/config/server.properties:/etc/kafka/server.properties
         - /root/kafka/config/consumer.properties:/etc/kafka/consumer.properties
      environment:
         KAFKA_ADVERTISED_LISTENERS: PLAINTEXT://<vsr-server-ip>:9092
         KAFKA_LISTENER_SECURITY_PROTOCOL_MAP: PLAINTEXT:PLAINTEXT,PLAINTEXT_HOST:PLAINTEXT
         KAFKA_ZOOKEEPER_CONNECT: zookeeper:2181
         KAFKA_INTER_BROKER_LISTENER_NAME: PLAINTEXT
         KAFKA_OFFSETS_TOPIC_REPLICATION_FACTOR: 1
      depends_on:
         - zookeeper
      networks:
         - kafka-network

networks:
   kafka-network:
      driver: bridge
Change the vrf-server-ip by the reachable IP address of the Virtual Service Router where
the monitoring is configured.
Save this file in a folder /root/kafka with the name kafka.yaml on the
external machine.
Note
The Apache Kafka server depends on Apache Zookeeper which is responsible for coordinating the distributed brokers within the cluster.
The Docker file also comes with two configuration files:
1. server.properties: used to configure settings for Kafka brokers. Here is
a tested example of this file content:
############################# Server Basics #################################

broker.id=0

############################# Socket Server Settings ########################

num.network.threads=3
num.io.threads=8
socket.send.buffer.bytes=102400
socket.receive.buffer.bytes=102400
socket.request.max.bytes=104857600

############################# Log Basics ####################################

log.dirs=/tmp/kafka-logs
num.partitions=1
num.recovery.threads.per.data.dir=1

############################# Internal Topic Settings  ######################

offsets.topic.replication.factor=1
transaction.state.log.replication.factor=1
transaction.state.log.min.isr=1

############################# Log Retention Policy ##########################

log.retention.hours=168
log.retention.check.interval.ms=300000

############################# Zookeeper #####################################

zookeeper.connect=localhost:2181
zookeeper.connection.timeout.ms=18000

############################# Group Coordinator Settings ####################

group.initial.rebalance.delay.ms=0
Save this file at the path /root/kafka/config/server.properties to make it
work with the Docker compose file on the external machine.
2. consumer.properties: used to configure settings for Kafka consumers. The
consumer reads the data sent to Apache Kafka. Here is a tested example of this
file content:
# list of brokers used for bootstrapping knowledge about the rest of the cluster
# format: host1:port1,host2:port2 ...
bootstrap.servers=localhost:9092

# consumer group id
group.id=test-consumer-group
Save this file at the path /root/kafka/config/consumer.properties to make it
work with the Docker compose file on the external machine.
To run the server in the background, run the following command:
$ docker compose -f /root/kafka/kafka.yaml up -d
To test that the metrics are properly sent to the server, run a consumer of the Kafka broker that is going to read up to 1600 messages at once (rough estimation of the number of metrics sent with each batch):
$ docker exec -it kafka kafka-console-consumer \
   --topic telegraf \
   --bootstrap-server localhost:9092 \
   --from-beginning \
   --max-messages 1600 \
   --consumer.config /etc/kafka/consumer.properties

{"fields":{"licensed-feature-enabled":1},"name":"product-license","tags":{"host":"dut-vm","name":"product"},"timestamp":1712958247}

{"fields":{"licensed-feature-counter-allowed":100,"licensed-feature-counter-description":"Throughput in Gb.","licensed-feature-counter-used":0},"name":"product-license","tags":{"host":"dut-vm","licensed-feature":"product","name":"throughput"},"timestamp":1712958247}

{"fields":{"licensed-feature-enabled":1},"name":"product-license","tags":{"host":"dut-vm","name":"bng-ipoe"},"timestamp":1712958247}

{"fields":{"licensed-feature-counter-allowed":100000,"licensed-feature-counter-description":"BNG sessions. IPoE and PPPoE sessions are shared.","licensed-feature-counter-used":0},"name":"product-license","tags":{"host":"dut-vm","licensed-feature":"bng-ipoe","name":"sessions"},"timestamp":1712958247}

{"fields":{"licensed-feature-enabled":1},"name":"product-license","tags":{"host":"dut-vm","name":"bng-pppoe"},"timestamp":1712958247}

{"fields":{"licensed-feature-counter-allowed":100000,"licensed-feature-counter-description":"BNG sessions. IPoE and PPPoE sessions are shared.","licensed-feature-counter-used":0},"name":"product-license","tags":{"host":"dut-vm","licensed-feature":"bng-pppoe","name":"sessions"},"timestamp":1712958247}

...
Note
For a production environment, a TLS/SSL to Apache Kafka is configurable via the nc-cli.
Elasticsearch
Elasticsearch is a scalable, distributed search and analytics engine designed for ingesting, indexing, and analyzing large volumes of monitoring and metrics data in real-time.
To configure the export of the KPIs to Elasticsearch, provide the URL with
the IP address and port (usually the port 9200) where the Elasticsearch
server is running:
vsr> edit running
vsr running config# vrf main kpi telegraf elasticsearch-output url http://<elasticsearch-server-ip>:9200
The connection to Elasticsearch has been tested with the following Docker image: elasticsearch/elasticsearch:7.14.0.
An example of Docker configuration of an Apache Kafka server can be done with a docker-compose file on an external machine as followed:
version: '3'
services:
   elasticsearch:
      image: docker.elastic.co/elasticsearch/elasticsearch:7.14.0
      container_name: elasticsearch
      environment:
         - node.name=elasticsearch
         - cluster.name=es-docker-cluster
         - discovery.type=single-node
      ports:
         # Expose port 9200 for HTTP REST API (External access)
         - "9200:9200"
         # Port 9300 is used for node-to-node communication within an
         # Elasticsearch cluster is not required for single-node setup but it
         # can be for troubleshooting, maintenance and testing
         # - "9300:9300"
Save this file in a folder /root/elasticsearch with the name
elasticsearch.yaml.
To run the server in the background, run the following command:
$ docker compose -f /root/elasticsearch/elasticsearch.yaml up -d
After the server is launched with the above command, it is accessible on the
port 9200. It can be queried with the cURL command and the Elasticsearch REST
API.
First of all, find the name of the index where the metrics have been stored on the Elasticsearch server.
$ curl -XGET 'http://localhost:9200/_cat/indices?v'
health status index               uuid                   pri rep docs.count docs.deleted store.size pri.store.size
green  open   .geoip_databases    BI_txwnTRPi0EI0vfZC1wQ   1   0         35            0     32.4mb         32.4mb
yellow open   telegraf-2024.04.23 NiQqzZCqT1-RLxPrAaPMNw   1   1       9493            0      1.7mb          1.7mb
The index at stake is called telegraf-2024.04.23.
Let’s list the metrics stored at this index:
$ curl -XGET 'http://localhost:9200/telegraf-2024.04.23/_search?pretty'
{
   "took" : 284,
   "timed_out" : false,
   "_shards" : {
      "total" : 1,
      "successful" : 1,
      "skipped" : 0,
      "failed" : 0
   },
   "hits" : {
      "total" : {
         "value" : 10000,
         "relation" : "gte"
      },
      "max_score" : 1.0,
      "hits" : [
         {
            "_index" : "telegraf-2024.04.23",
            "_type" : "_doc",
            "_id" : "numuC48BXU3WjTnEIhEj",
            "_score" : 1.0,
            "_source" : {
               "@timestamp" : "2024-04-23T17:57:25.207511552+02:00",
               "fp-vlan-stats" : {
                  "vlan-dropped-in-operative" : 0,
                  "vlan-dropped-input-unknown-interface" : 0,
                  "vlan-dropped-invalid-tag" : 0,
                  "vlan-dropped-out-operative" : 0,
                  "vlan-dropped-prepend-failure" : 0,
                  "vlan-output-unknown-interface" : 0,
                  "vlan-unknown-tag" : 0
               },
               "measurement_name" : "fp-vlan-stats",
               "tag" : {
                  "host" : "dut-vm"
               }
            }
         },
         ...
      ]
   }
}
Values for a particular service (here fp-vlan-stats) can be retrieved as
followed:
$ curl -XGET 'http://localhost:9200/telegraf-2024.04.23/_search?pretty' \
-H 'Content-Type: application/json' -d '{
   "query": {
      "match": {
         "measurement_name": "fp-vlan-stats"
      }
   },
   "_source": ["@timestamp", "fp-vlan-stats.*"]
}'
{
   "took" : 296,
   "timed_out" : false,
   "_shards" : {
      "total" : 1,
      "successful" : 1,
      "skipped" : 0,
      "failed" : 0
   },
   "hits" : {
      "total" : {
         "value" : 1427,
         "relation" : "eq"
      },
      "max_score" : 11.12297,
      "hits" : [
         {
         "_index" : "telegraf-2024.04.23",
         "_type" : "_doc",
         "_id" : "numuC48BXU3WjTnEIhEj",
         "_score" : 11.12297,
         "_source" : {
            "@timestamp" : "2024-04-23T17:57:25.207511552+02:00",
            "fp-vlan-stats" : {
               "vlan-dropped-invalid-tag" : 0,
               "vlan-dropped-prepend-failure" : 0,
               "vlan-output-unknown-interface" : 0,
               "vlan-unknown-tag" : 0,
               "vlan-dropped-in-operative" : 0,
               "vlan-dropped-input-unknown-interface" : 0,
               "vlan-dropped-out-operative" : 0
            }
         }
      },
      {
         "_index" : "telegraf-2024.04.23",
         "_type" : "_doc",
         "_id" : "numuC48BXU3WjTnEIhEj",
         "_score" : 11.12297,
         "_source" : {
            "@timestamp" : "2024-04-23T17:57:25.207511552+02:00",
            "fp-vlan-stats" : {
               "vlan-dropped-invalid-tag" : 0,
               "vlan-dropped-prepend-failure" : 0,
               "vlan-output-unknown-interface" : 0,
               "vlan-unknown-tag" : 0,
               "vlan-dropped-in-operative" : 0,
               "vlan-dropped-input-unknown-interface" : 0,
               "vlan-dropped-out-operative" : 0
            }
         }
      },
      ...
   ]
}
Note
For a production environment, a TLS/SSL to Apache Kafka is configurable via the nc-cli.
Graphite
Graphite is an open-source tool for monitoring and graphing time-series data. It is designed to collect, store, and visualize numeric data over time.
To configure the export of the KPIs to Graphite, provide the server URL with
the IP address and port (usually the port 2003) where the Graphite server
is running:
vsr> edit running
vsr running config# vrf main kpi telegraf graphite-output server <graphite-server-ip>:2003
vsr running config# commit
Note
Graphite does not support string values metrics such as product-version.
The connection to Graphite has been tested with the following Docker image: graphiteapp/graphite-statsd:1.1.10-5.
An example of Docker configuration of a Graphite server can be done with a docker-compose file on an external machine as followed:
version: '3'
services:
   graphite:
      image: graphiteapp/graphite-statsd:1.1.10-5
      container_name: graphite
      ports:
         # Graphite-Web served locally on port 8080
         - "8080:80"
         # Carbon receiver
         - "2003:2003"
      volumes:
         # To setup MAX_CREATES_PER_MINUTE to inf for getting data quick
         - /root/graphite/carbon.conf:/opt/graphite/conf/carbon.conf
      restart: always
Save this file in a folder /root/graphite with the name graphite.yaml.
The port 2003 will establish the connection to Telegraf via the internal
Carbon to handle the metrics in
Graphite server.
The Docker file also comes with the configuration file:
[cache]
ENABLE_LOGROTATION = True
MAX_CACHE_SIZE = inf
MAX_UPDATES_PER_SECOND = 500
MAX_CREATES_PER_MINUTE = inf
MIN_TIMESTAMP_RESOLUTION = 1
LINE_RECEIVER_INTERFACE = 0.0.0.0
LINE_RECEIVER_PORT = 2003
ENABLE_UDP_LISTENER = False
UDP_RECEIVER_INTERFACE = 0.0.0.0
UDP_RECEIVER_PORT = 2003
PICKLE_RECEIVER_INTERFACE = 0.0.0.0
PICKLE_RECEIVER_PORT = 2004
MAX_RECEIVER_CONNECTIONS = inf
USE_INSECURE_UNPICKLER = False
CACHE_QUERY_INTERFACE = 0.0.0.0
CACHE_QUERY_PORT = 7002
USE_FLOW_CONTROL = True
LOG_UPDATES = True
LOG_CREATES = True
LOG_CACHE_HITS = True
LOG_CACHE_QUEUE_SORTS = True
CACHE_WRITE_STRATEGY = sorted
WHISPER_AUTOFLUSH = False
WHISPER_FALLOCATE_CREATE = False
CARBON_METRIC_INTERVAL = 10
ENABLE_AMQP = False
AMQP_VERBOSE = False
AMQP_HOST = localhost
AMQP_PORT = 5672
AMQP_VHOST = /
AMQP_USER = guest
AMQP_PASSWORD = guest
AMQP_EXCHANGE = graphite
AMQP_METRIC_NAME_IN_BODY = False
GRAPHITE_URL = http://127.0.0.1:8080
ENABLE_TAGS = True
LOG_LISTENER_CONN_SUCCESS = True

[relay]
LINE_RECEIVER_INTERFACE = 0.0.0.0
LINE_RECEIVER_PORT = 2013
PICKLE_RECEIVER_INTERFACE = 0.0.0.0
PICKLE_RECEIVER_PORT = 2014
RELAY_METHOD = rules
REPLICATION_FACTOR = 1
DESTINATIONS = 127.0.0.1:2004
MAX_QUEUE_SIZE = 10000
MAX_DATAPOINTS_PER_MESSAGE = 500
QUEUE_LOW_WATERMARK_PCT = 0.8
TIME_TO_DEFER_SENDING = 0.0001
USE_FLOW_CONTROL = True
CARBON_METRIC_INTERVAL = 10
LOG_LISTENER_CONN_SUCCESS = False
USE_RATIO_RESET=False
MIN_RESET_STAT_FLOW=1000
MIN_RESET_RATIO=0.9
MIN_RESET_INTERVAL=121

[aggregator]
LINE_RECEIVER_INTERFACE = 0.0.0.0
LINE_RECEIVER_PORT = 2023
PICKLE_RECEIVER_INTERFACE = 0.0.0.0
PICKLE_RECEIVER_PORT = 2024
FORWARD_ALL = True
DESTINATIONS = 127.0.0.1:2004
REPLICATION_FACTOR = 1
MAX_QUEUE_SIZE = 10000
USE_FLOW_CONTROL = True
MAX_DATAPOINTS_PER_MESSAGE = 500
MAX_AGGREGATION_INTERVALS = 5
CARBON_METRIC_INTERVAL = 10
LOG_LISTENER_CONN_SUCCESS = True
LOG_AGGREGATOR_MISSES = True
Save this file at the path /root/graphite/carbon.conf to make it
work with the Docker compose file on the external machine.
To run the server in the background, run the following command:
$ docker compose -f /root/graphite/graphite.yaml up -d
To test that the metrics are properly sent to the server, open the port
8080 on the monitoring sever in a browser. It will open the Graphite-Web interface on which metrics
can be visualized.
Alternatively, list the sent metrics using the Graphite API:
$ curl http://127.0.0.1:8080/metrics/index.json
[
   "carbon.agents.a5f10e4c5850-a.activeConnections",
   "carbon.agents.a5f10e4c5850-a.avgUpdateTime",
   "carbon.agents.a5f10e4c5850-a.blacklistMatches",
   ...,
   "dut-vm.cpu0.system-cpu-times.guest",
   "dut-vm.cpu0.system-cpu-times.guest-nice",
   "dut-vm.cpu0.system-cpu-times.idle",
   "dut-vm.cpu0.system-cpu-times.iowait",
   "dut-vm.cpu0.system-cpu-times.irq",
   "dut-vm.cpu0.system-cpu-times.nice",
   ...
]
Note
The TLS connection to Graphite via Telegraf is not supported.
InfluxDB
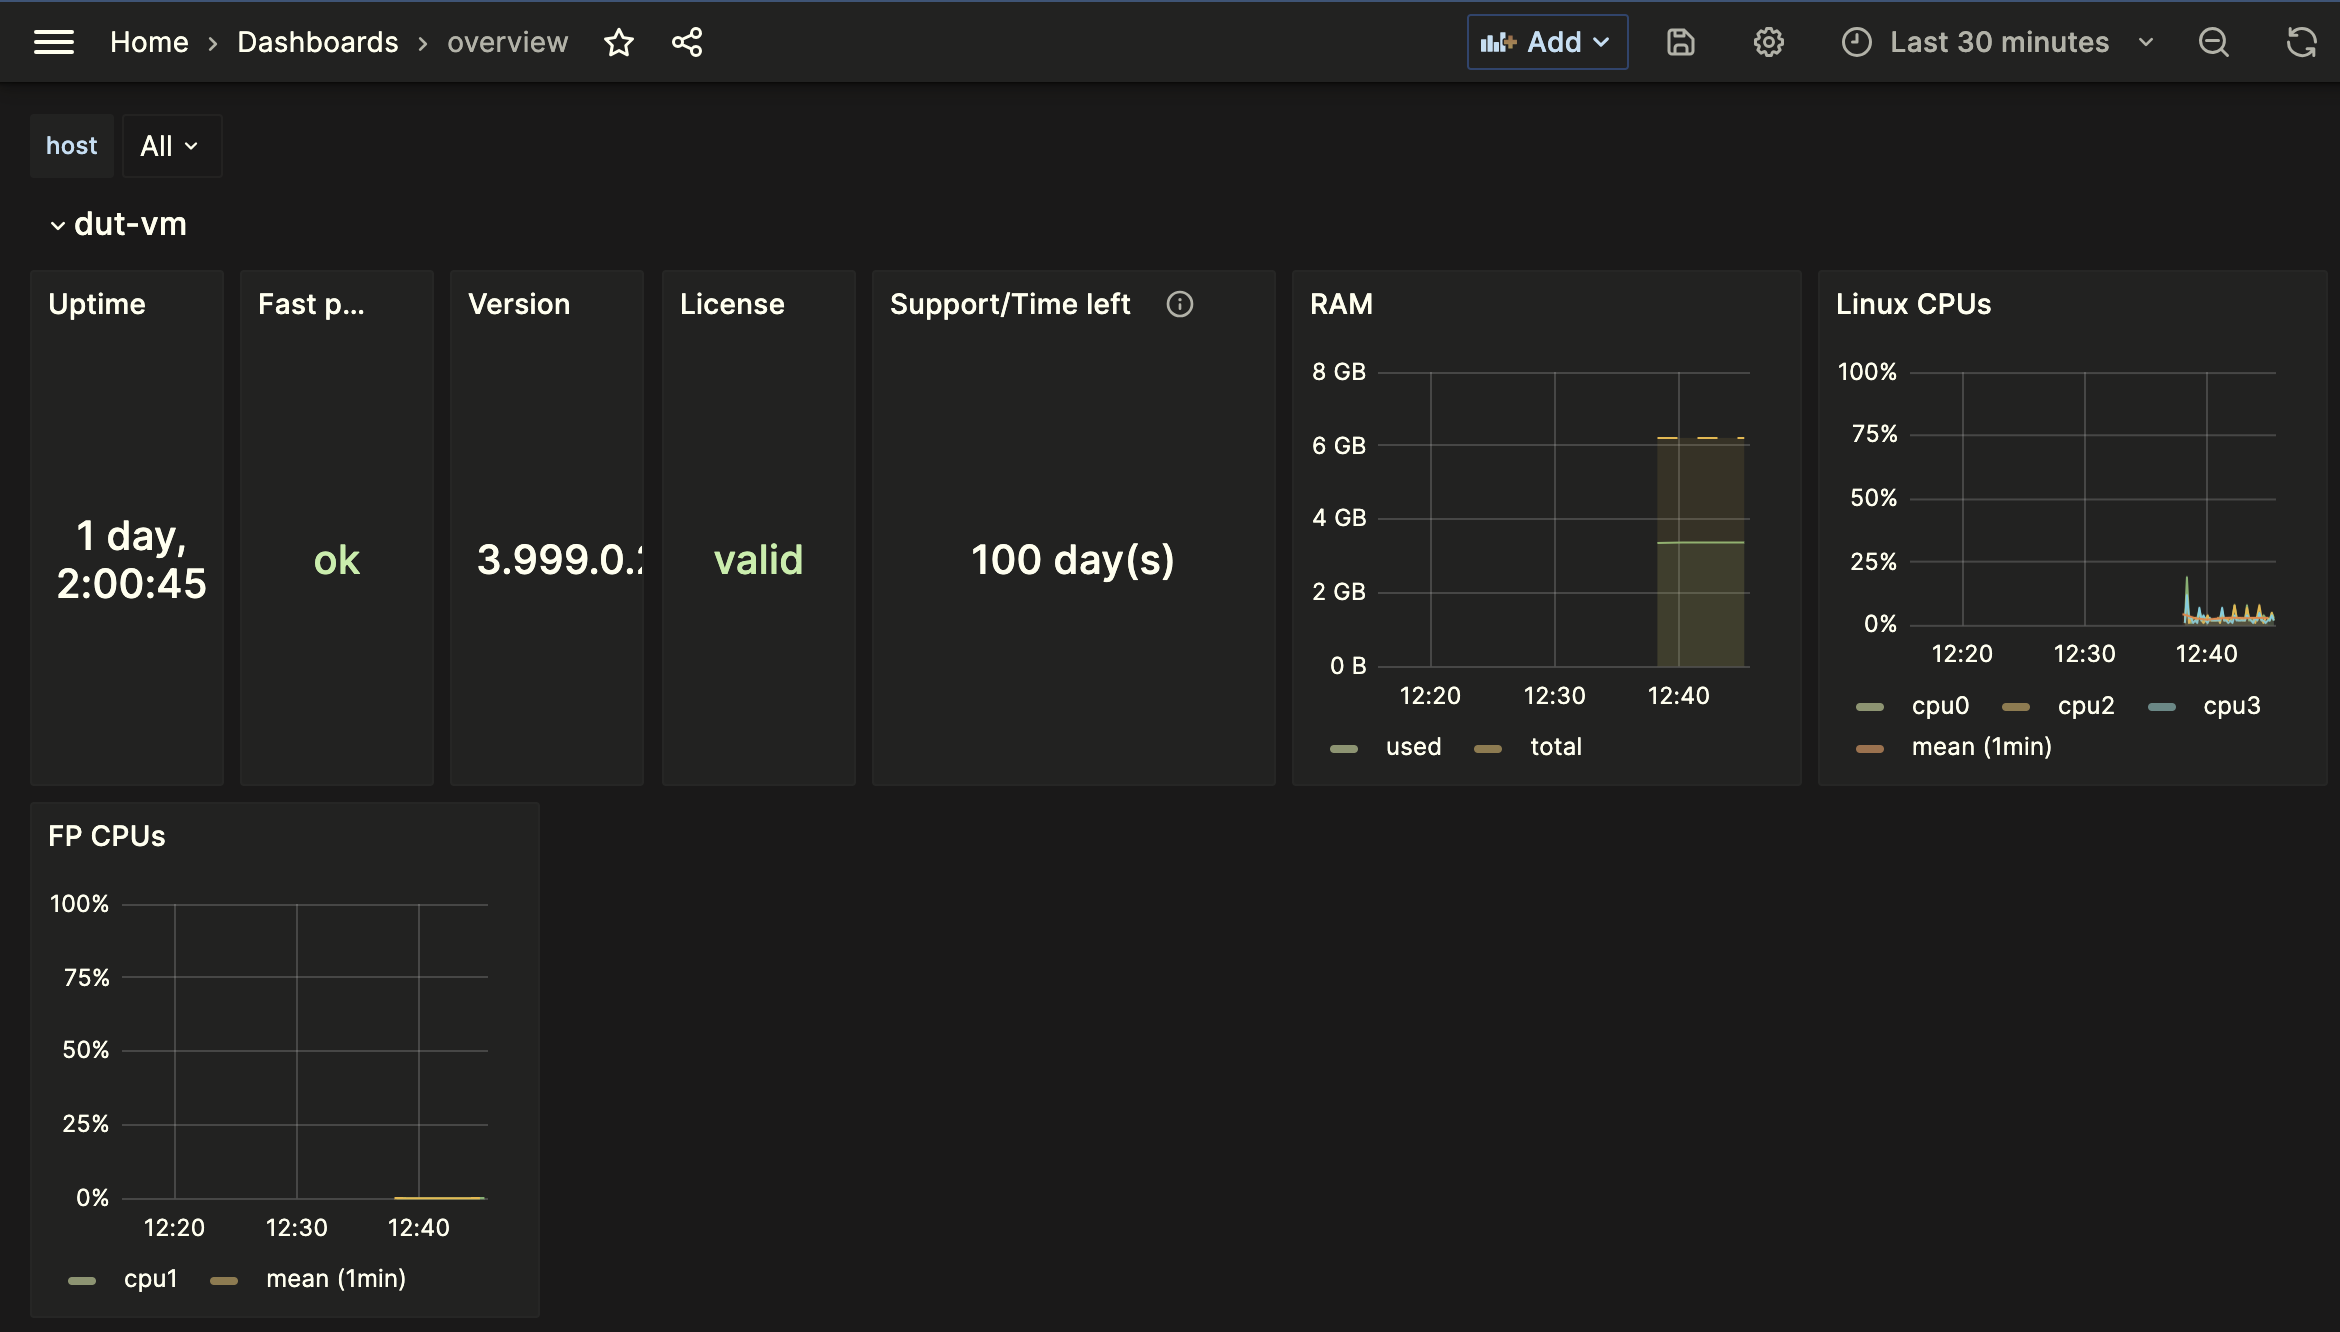
InfluxDB is a time-series database designed to handle high write and query loads. It is 6WIND monitoring tool of choice to export Virtual Service Router KPIs. It can be integrated with an analytics frontend, such as Grafana
To configure the export of the KPIs to InfluxDB, provide the URL with
the IP address and port (usually the port 8086) where the InfluxDB server is
running and a Telegraf database where the KPIs will be collected:
vsr> edit running
vsr running config# vrf main kpi telegraf influxdb-output url http://<influxdb-server-ip>:8086 database test
Note
To connect Telegraf to a secured InfluxDB instance (https URL) that is using
a self-signed certificate, insecure-skip-verify must be enabled.
The connection to Influx has been tested with the following Docker image. An end-to-end InfluxDB/Grafana setup is available on 6WIND’s github with pre-made dashboards that are easily customable. Here is an example of one of these dashboards:
InfluxDB V2
InfluxDB V2 is the latest major version of the InfluxData time-series database platform, which is designed for handling high volumes of time-stamped data.
To configure the export of the KPIs to InfluxDB V2, provide:
the
urlwith the IP address and port (usually the port8086) where the InfluxDBv2 is runningthe
bucketwhere to write the metrics intothe
organizationthat owns the bucket
Here is an example:
vsr> edit running
vsr running config# / vrf main kpi telegraf influxdbv2-output url http://<influxdb-v2-server-ip>:8086
vsr running config# / vrf main kpi telegraf influxdbv2-output organization 6wind
vsr running config# / vrf main kpi telegraf influxdbv2-output bucket telegraf
vsr running config# commit
Note
To connect Telegraf to a secured InfluxDB instance (https URL) that is
using a self-signed certificate, insecure-skip-verify must be enabled.
Prometheus
Prometheus is an open-source monitoring and alerting toolkit designed for collecting, storing, querying, and alerting on time-series data. It is specifically tailored for monitoring dynamic, cloud-native environments and microservices architectures.
Contrary to the other monitoring services, Prometheus is a client that is going
to request Telegraf for new metrics. To configure the export of the KPIs to
Prometheus, provide the IP address and port (usually the port 9126) where
the Prometheus client (the Virtual Service Router instance) is located:
vsr> edit running
vsr running config# vrf main kpi telegraf prometheus-client-output address <vsr-server-ip> port 9126
Note
Prometheus does not support string values metrics such as product-version.
The connection to Prometheus has been tested with the following Docker image: prom/prometheus:v2.47.1.
An example of Docker configuration of a Prometheus server can be done with a docker-compose file on an external machine as followed:
version: "3"
services:
prometheus:
   image: prom/prometheus:v2.47.1
   container_name: prometheus
   command:
      - "--config.file=/etc/prometheus/config.yaml"
   volumes:
      # Make a read only volume of the Prometheus config file
      - /root/prometheus/config.yaml:/etc/prometheus/config.yaml:ro
   ports:
      # Expose Prometheus web interface on port 8080
      - "8080:9090"
   restart: always
Save this file in a folder /root/prometheus with the name
prometheus.yaml.
The Docker file also comes with a YAML configuration file for the Prometheus client:
global:
scrape_interval: 10s

scrape_configs:
- job_name: 'telegraf'
   static_configs:
      - targets: ['<vsr-server-ip>:9126']
Replace the <vsr_server_ip> with the actual IP address of the Virtual Service Router on which
Telegraf is configured and save his file at the path
/root/prometheus/config.yaml to make it work with the Docker compose file on
the external machine.
To run the Prometheus client instance in the background, run the following command:
$ docker compose -f /root/prometheus/prometheus.yaml up -d
To test that the metrics are properly sent to the server, open the port
8080 on the monitoring sever in a browser. It will open the Prometheus Web UI
on which metrics can be visualized.
Alternatively you can list the metrics using the Prometheus API
<https://prometheus.io/docs/prometheus/latest/querying/api/>:
$ curl http://127.0.0.1:9090/api/v1/label/__name__/values
{
   "status":"success",
   "data":[
      "alarm_summary_cleared",
      "alarm_summary_not_cleared",
      "alarm_summary_total",
      "fp_cpu_usage_busy",
      "fp_filling_bridge_fdb_current",
      "fp_filling_bridge_fdb_max",
      "fp_filling_bridge_interfaces_current",
      "fp_filling_bridge_interfaces_max",
      "fp_filling_bridge_ports_current",
      "fp_filling_bridge_ports_max",
      "fp_filling_cg_nat_cur_block_translation_ips",
      "fp_filling_cg_nat_cur_blocks",
      "fp_filling_cg_nat_cur_nat",
      "fp_filling_cg_nat_cur_pools",
      "fp_filling_cg_nat_cur_port_translation_ips",
      ...
   ],
}
Note
For a production environment, a TLS/SSL to Prometheus is configurable via the nc-cli.
New Relic
New Relic is a cloud-based observability platform that provides monitoring, alerting, and analytics for applications and infrastructure. It allows exporting KPIs to the New Relic Metrics API for visualization and analysis in the New Relic dashboard.
To configure the export of the KPIs to New Relic, provide:
the
urlof the New Relic Metrics API endpoint:US datacenter:
https://metric-api.newrelic.com/metric/v1EU datacenter:
https://metric-api.eu.newrelic.com/metric/v1
the
ingest-keywhich is the New Relic License Key for authentication
Here is an example for the US datacenter:
vsr running config# / vrf main kpi telegraf newrelic-output url https://metric-api.newrelic.com/metric/v1 ingest-key YOUR_NEW_RELIC_LICENSE_KEY
Optionally, a metric-prefix can be configured to add a prefix to all metric
names. This is useful to distinguish metrics from different Virtual Service Router instances
in the New Relic dashboard:
vsr running config# / vrf main kpi telegraf newrelic-output url https://metric-api.newrelic.com/metric/v1 metric-prefix vsr1
To verify that the metrics are being received, log in to the New Relic dashboard and navigate to the Metrics explorer. The exported metrics will appear with the configured prefix (if set) and can be queried using NRQL (New Relic Query Language):
SELECT * FROM Metric WHERE metricName LIKE 'vsr1.%' SINCE 10 minutes ago
Note
The New Relic License Key (ingest key) can be found in the New Relic account settings under “API keys”. Make sure to use a License key (also called ingest key), not a User key.
Migration from the legacy kpi system
Here is an example of migration from the legacy KPI system. Given the
following configuration that enables the default KPIs, and monitors vlan0
and vlan1 in vrf main, and mgmt0 in vrf mgmt:
vsr running config# / system kpi
vsr running config# / vrf main kpi interface vlan0
vsr running config# / vrf main kpi interface vlan1
vsr running config# / vrf mgmt kpi interface mgmt0
vsr running config# / vrf main kpi telegraf influxdb-output url http://1.1.1.1:8086 database test
The following commands should be issued:
vsr running config# del / system kpi
vsr running config# del / vrf main kpi interface vlan0
vsr running config# del / vrf main kpi interface vlan1
vsr running config# del / vrf mgmt kpi
vsr running config# / vrf main kpi telegraf metrics monitored-interface name vlan0 vrf main
vsr running config# / vrf main kpi telegraf metrics monitored-interface name vlan1 vrf main
vsr running config# / vrf main kpi telegraf metrics monitored-interface name mgmt0 vrf mgmt
vsr running config# / vrf main kpi telegraf influxdb-output url http://1.1.1.1:8086 database test
vsr running config/# commit
After the migration, there can be conflicts happening in the InfluxDB database. A warning similar to this log will be displayed in the Virtual Service Router logs:
(...) telegraf[2440]: (...) [outputs.influxdb] Failed to write metric (will be dropped: 400 Bad Request):
partial write: field type conflict: input field "XXX" on measurement "YYY" is type float, already exists
as type string dropped=1
To fix those conflicts, the measurement triggering the problem must be dropped on the InfluxDB server. One way of doing it is to run this command on a machine that has access to the InfluxDB server:
# curl -XPOST "http://<influxdb-server-ip>:8086/query?db=<database>" --data-urlencode "q=drop measurement \"YYY\""
Collected metrics
All the available metrics can be found in this section.
alarm-summary
The number of alarms on the system per criticity.
Measure |
Type |
Description |
|---|---|---|
severity |
severity |
Alarm summary for this severity level. |
total |
gauge32 |
Total number of alarms of this severity level. |
not-cleared |
gauge32 |
Total number of alarms of this severity level that are not cleared. |
cleared |
gauge32 |
For this severity level, the number of alarms that are cleared. |
bng-ipoe-server-stats
The IPoE server statistics.
Measure |
Type |
Description |
|---|---|---|
sessions |
uint32 |
Session count. |
subscribers |
uint32 |
Subscriber count. |
bng-pppoe-server-stats
The PPPoE server statistics.
Measure |
Type |
Description |
|---|---|---|
sessions |
uint32 |
Session count. |
subscribers |
uint32 |
Subscriber count. |
pppoe-received-padi |
uint64 |
Show counters for PADI received packets. |
pppoe-dropped-padi |
uint64 |
Show counters for dropped PADI packets. |
pppoe-sent-pado |
uint64 |
Show counters for PADO sent packets. |
pppoe-received-padr |
uint64 |
Show counters for PADR received packets. |
pppoe-sent-pads |
uint64 |
Show counters for PADS sent packets. |
pppol2tp-tunnels-starting |
uint64 |
Show starting sessions. |
pppol2tp-tunnels-active |
uint64 |
Show active sessions. |
pppol2tp-tunnels-finishing |
uint64 |
Show finishing sessions. |
pppol2tp-control-sessions-starting |
uint64 |
Show starting sessions. |
pppol2tp-control-sessions-active |
uint64 |
Show active sessions. |
pppol2tp-control-sessions-finishing |
uint64 |
Show finishing sessions. |
pppol2tp-data-sessions-starting |
uint64 |
Show starting sessions. |
pppol2tp-data-sessions-active |
uint64 |
Show active sessions. |
pppol2tp-data-sessions-finishing |
uint64 |
Show finishing sessions. |
fp-bridge-stats
The fast path bridge statistics.
Measure |
Type |
Description |
|---|---|---|
l2-forwarded-frames |
uint64 |
Number of packets forwarded at layer 2 (bridging processing) (L2ForwFrames). |
l2-forwarded-frames-cpu-id |
uint16 |
Core ID. |
l2-forwarded-frames-cpu-value |
uint64 |
Core statistic. |
bridge-dropped-forwarding-invalid |
uint64 |
Number of output packets dropped in bridge due to forbidden forwarding (forwarding disable or originating port) (BridgeDroppedFwdInvalid). |
bridge-dropped-forwarding-invalid-cpu-id |
uint16 |
Core ID. |
bridge-dropped-forwarding-invalid-cpu-value |
uint64 |
Core statistic. |
bridge-dropped-input-lookup-error |
uint64 |
Number of input packets dropped in bridge due to a lookup error (BridgeDroppedInputLookupError). |
bridge-dropped-input-lookup-error-cpu-id |
uint16 |
Core ID. |
bridge-dropped-input-lookup-error-cpu-value |
uint64 |
Core statistic. |
bridge-dropped-invalid-output-port |
uint64 |
Number of output packets dropped in bridge because output port index is invalid (BridgeDroppedInvalidOutPort). |
bridge-dropped-invalid-output-port-cpu-id |
uint16 |
Core ID. |
bridge-dropped-invalid-output-port-cpu-value |
uint64 |
Core statistic. |
bridge-dropped-invalid-source |
uint64 |
Number of input packets dropped in bridge due to invalid mac source (BridgeDroppedInvalidSrc). |
bridge-dropped-invalid-source-cpu-id |
uint16 |
Core ID. |
bridge-dropped-invalid-source-cpu-value |
uint64 |
Core statistic. |
bridge-dropped-invalid-state |
uint64 |
Number of input packets dropped in bridge due to invalid state (not learning or forwarding) of the bridge (BridgeDroppedInvalidState). |
bridge-dropped-invalid-state-cpu-id |
uint16 |
Core ID. |
bridge-dropped-invalid-state-cpu-value |
uint64 |
Core statistic. |
bridge-dropped-learning |
uint64 |
Number of output packets dropped in bridge while it is in learning state (BridgeDroppedLearning). |
bridge-dropped-learning-cpu-id |
uint16 |
Core ID. |
bridge-dropped-learning-cpu-value |
uint64 |
Core statistic. |
bridge-dropped-mtu-exceeded |
uint64 |
Number of output packets dropped in bridge due to MTU greater than the authorized one (BridgeDroppedMtuExceeded). |
bridge-dropped-mtu-exceeded-cpu-id |
uint16 |
Core ID. |
bridge-dropped-mtu-exceeded-cpu-value |
uint64 |
Core statistic. |
bridge-dropped-no-output-port |
uint64 |
Number of output packets dropped in bridge due to no valid output (BridgeDroppedNoOutputPort). |
bridge-dropped-no-output-port-cpu-id |
uint16 |
Core ID. |
bridge-dropped-no-output-port-cpu-value |
uint64 |
Core statistic. |
bridge-dropped-output-lookup-error |
uint64 |
Number of output packets dropped in bridge due to a lookup error (BridgeDroppedOutputLookupError). |
bridge-dropped-output-lookup-error-cpu-id |
uint16 |
Core ID. |
bridge-dropped-output-lookup-error-cpu-value |
uint64 |
Core statistic. |
bridge-dropped-output-unknown |
uint64 |
Number of output packets dropped in bridge due to an unknown output (BridgeDroppedOutputUnknown). |
bridge-dropped-output-unknown-cpu-id |
uint16 |
Core ID. |
bridge-dropped-output-unknown-cpu-value |
uint64 |
Core statistic. |
bridge-dropped-pause-frame |
uint64 |
Number of input packets dropped in bridge because it is a pause frame (BridgeDroppedPauseFrame). |
bridge-dropped-pause-frame-cpu-id |
uint16 |
Core ID. |
bridge-dropped-pause-frame-cpu-value |
uint64 |
Core statistic. |
bridge-dropped-unknown-interface |
uint64 |
Number of input packets dropped in bridge due to an invalid interface (BridgeDroppedUnknownIface). |
bridge-dropped-unknown-interface-cpu-id |
uint16 |
Core ID. |
bridge-dropped-unknown-interface-cpu-value |
uint64 |
Core statistic. |
bridge-fdb-synchronization-error |
uint64 |
Number of packets dropped in bridge due to fdb synchronization error (BridgeFdbSyncError). |
bridge-fdb-synchronization-error-cpu-id |
uint16 |
Core ID. |
bridge-fdb-synchronization-error-cpu-value |
uint64 |
Core statistic. |
fp-cg-nat-stats
The fast path CG-NAT statistics (requires CG-NAT license).
Measure |
Type |
Description |
|---|---|---|
hairpinned-packets |
uint64 |
Number of packets forwarded between two hosts under the same NAT device. The two hosts communicate with each other using their external IP address. |
loop-hairpin-dropped-packets |
uint64 |
Number of hairpinned packets dropped due to the detection of a routing loop. |
self-hairpin-dropped-packets |
uint64 |
Number of hairpinned packets dropped due to a host attempting to send packets to its own NATed address. |
nat-allocations |
uint64 |
Number of NAT allocations. |
nat-destructions |
uint64 |
Number of NAT destructions. |
nat-allocation-failures |
uint64 |
Number of NAT allocation failures. |
nat-association-races |
uint64 |
Number of NAT association races. This race occurs when a CPU attempts to associate a NAT object with a conntrack object that has already been associated by another CPU in the meantime. |
nat-port-allocation-failures |
uint64 |
Number of NAT port allocation failures. |
nat-port-overloading-allocations |
uint64 |
Number of NAT port overloaded allocations. |
nat-port-overloading-destructions |
uint64 |
Number of NAT port overloaded destructions. |
nat64-udp-null-checksum-dropped-packets |
uint64 |
Number of dropped IPv4 UDP packets with null checksums. While in IPv6, null checksums are not allowed for UDP. When nating from IPv4 to IPv6, if the UDP checksum is NULL, it cannot be modified. In this case, the packet is dropped. It is possible to compute a full checksum by setting an option for NAT64. |
nat64-out-of-prefix-dropped-packets |
uint64 |
Number of packets dropped when extracting the IPv4-embedded address from an IPv6 packet that does not match the configured NAT64 prefix. |
nat64-destination-prefix-strip-errors |
uint64 |
Number of packets dropped when extracting the IPv4-embedded address from an IPv6 packet that does not match the configured NAT64 prefix. |
block-allocations |
uint64 |
Number of block allocations. |
block-destructions |
uint64 |
Number of block destructions. |
block-allocation-failures |
uint64 |
Number of block allocation failures. It happens when there are no blocks available in the pool. |
user-allocations |
uint64 |
Number of user allocations. |
user-destructions |
uint64 |
Number of user destructions. |
user-allocation-failures |
uint64 |
Number of user allocation failures. |
user-duplicate-races |
uint64 |
Number of attempts to create a duplicate user. This race occurs when a CPU attempts to create a new user that has already been created by another CPU in the meantime. |
user-association-races |
uint64 |
Number of user association races. This race occurs when a CPU attempts to associate a NAT object with a user object, indicating that the user object has already been released by another CPU. |
user-too-many-conntracks |
uint64 |
Number of times a user attempts to create more conntracks than the maximum allowed (i.e. max-conntracks-per-user in the cgnat rule). |
user-no-public-ip-errors |
uint64 |
Number of user allocation failures due the depletion of all available public IPs. |
user-full-public-ip-errors |
uint64 |
Number of block allocation failures due to the unavailability of port blocks in the user’s public IP. |
log-build-failures |
uint64 |
Number of log generation failures. |
log-transmit-to-local-server |
uint64 |
Number of logs successfully transmitted to the local server. |
log-transmit-errors-to-local-server |
uint64 |
Number of logs failed to transmit to the local server. |
log-transmit-to-remote-server |
uint64 |
Number of logs successfully transmitted to the remote servers. |
log-transmit-errors-to-remote-server |
uint64 |
Number of logs failed to transmit to the remote servers. |
fp-conntrack-stats
The fast path conntrack statistics.
Measure |
Type |
Description |
|---|---|---|
allocations |
uint64 |
Number of conntrack allocations. |
reverse-connections |
uint64 |
Number of conntracks tracking a reverse connection. |
destructions |
uint64 |
Number of conntrack destructions. |
allocation-failures |
uint64 |
Number of conntrack allocation failures. |
duplicate-races |
uint64 |
Number of attempts to create a duplicate conntrack. This race occurs when a CPU attempts to create a new conntrack that has already been created by another CPU in the meantime. |
ha-invalid-state |
uint64 |
Number of attempts to create a conntrack on a node participating to an ha group that is not the master node at the time of creation. |
tcp-non-syn-first-packet-drops |
uint64 |
Number of TCP conntracks failed due to a non-SYN first packet. |
tcp-invalid-sequence-order-rst-packet-drops |
uint64 |
Number of dropped out-of-order TCP RST packets (See RFC 5961). |
tcp-invalid-state-transition-packet-drops |
uint64 |
Number of TCP packets dropped due to invalid transitions in the TCP state machine based on the packet’s TCP flags. |
tcp-out-of-upper-bound-window-packet-drops |
uint64 |
Number of dropped out-of window TCP packets (upper boundary). |
tcp-out-of-lower-bound-window-packet-drops |
uint64 |
Number of dropped out-of window TCP packets (lower boundary). |
tcp-out-of-window-ack-packet-drops |
uint64 |
Number of TCP ACK packets dropped for acknowledging unsent packets. |
malformed-ip-header-packet-drops |
uint64 |
Number of packets dropped due to a malformed IP header. |
ha-invalid-state-packet-drops |
uint64 |
Number of packets dropped due to packet reception on synchronized conntracks in invalid ha state. |
fp-cp-protect-stats
The control plane protection module statistics per network interface.
Measure |
Type |
Description |
|---|---|---|
rx-control-plane-kept |
uint64 |
When the Rx ring filling reaches a threshold, packets are inspected by the Control Plane Protection mechanism. This statistic is incremented for packets recognized as CP packets, which are kept and processed by the stack. |
rx-control-plane-overrun |
uint64 |
When CPU consumption used by Control Plane Protection exceeds a threshold, this system is disabled. This statistic is incremented for each Rx packet not analyzed by Control Plane Protection due to CPU overload. |
rx-control-plane-passthrough |
uint64 |
When Control Plane Protection is enabled, this statistic is incremented for each packet received when machine is not overloaded. These packets are processed normally. |
rx-data-plane-drop |
uint64 |
When the Rx ring filling reaches a threshold, packets are inspected by the Control Plane Protection mechanism. This statistic is incremented for packets recognized as DP packets, which are dropped. |
tx-control-plane-kept |
uint64 |
When the Tx ring filling reaches a threshold, packets are inspected by the Control Plane Protection mechanism. This statistic is incremented for packets recognized as CP packets, which are sent on the wire. |
tx-control-plane-overrun |
uint64 |
When CPU consumption used by Control Plane Protection exceeds a threshold, this system is disabled. This statistic is incremented for each Tx packet not analyzed by Control Plane Protection due to CPU overload. |
tx-control-plane-passthrough |
uint64 |
When Control Plane Protection is enabled, this statistic is incremented for each packet transmitted on a link that is not overloaded. These packets are sent normally. |
tx-data-plane-drop |
uint64 |
When the Tx ring filling reaches a threshold, packets are inspected by the Control Plane Protection mechanism. This statistic is incremented for packets recognized as DP packets, which are dropped. |
fp-cpu-usage
The list of busy percentage per fast path CPU.
Measure |
Type |
Description |
|---|---|---|
cpu |
string |
The CPU number. |
busy |
uint16 |
The busy percentage. |
fp-ddos-stats
The fast path DDoS protection statistics (requires DDoS protection license).
Measure |
Type |
Description |
|---|---|---|
pool-shortage-error |
uint64 |
Number of IP addresses not handled by the DDoS protection due to entry pool shortage. |
tcp-header-error |
uint64 |
Number of packets dropped due to invalid TCP header. |
udp-header-error |
uint64 |
Number of packets dropped due to invalid UDP header. |
icmp-header-error |
uint64 |
Number of packets dropped due to invalid ICMP header. |
whitelist-hit |
uint64 |
Number of packets forwarded because IP address is present in whitelist. |
global-icmp-echo-dropped-packets |
uint64 |
Number of packets dropped after global ICMP echo threshold reached. |
global-icmp-echo-dropped-bytes |
uint64 |
Number of bytes dropped after global ICMP echo threshold reached. |
global-tcp-syn-dropped-packets |
uint64 |
Number of packets dropped after global TCP syn echo threshold reached. |
global-tcp-syn-dropped-bytes |
uint64 |
Number of bytes dropped after global TCP syn threshold reached. |
global-tcp-syn-ack-dropped-packets |
uint64 |
Number of packets dropped after global TCP syn-ack threshold reached. |
global-tcp-syn-ack-dropped-bytes |
uint64 |
Number of bytes dropped after global TCP syn-ack threshold reached. |
global-tcp-ack-dropped-packets |
uint64 |
Number of packets dropped after global TCP ack threshold reached. |
global-tcp-ack-dropped-bytes |
uint64 |
Number of bytes dropped after global TCP ack threshold reached. |
global-tcp-rst-dropped-packets |
uint64 |
Number of packets dropped after global TCP rst threshold reached. |
global-tcp-rst-dropped-bytes |
uint64 |
Number of bytes dropped after global TCP rst threshold reached. |
global-udp-dns-dropped-packets |
uint64 |
Number of packets dropped after global UDP DNS threshold reached. |
global-udp-dns-dropped-bytes |
uint64 |
Number of bytes dropped after global UDP DNS threshold reached. |
global-udp-quic-dropped-packets |
uint64 |
Number of packets dropped after global UDP QUIC threshold reached. |
global-udp-quic-dropped-bytes |
uint64 |
Number of bytes dropped after global UDP QUIC threshold reached. |
global-udp-raw-dropped-packets |
uint64 |
Number of packets dropped after global UDP raw threshold reached. |
global-udp-raw-dropped-bytes |
uint64 |
Number of bytes dropped after global UDP raw threshold reached. |
source-icmp-echo-dropped-packets |
uint64 |
Number of packets dropped after source ICMP echo threshold reached. |
source-icmp-echo-dropped-bytes |
uint64 |
Number of bytes dropped after source ICMP echo threshold reached. |
source-tcp-syn-dropped-packets |
uint64 |
Number of packets dropped after source TCP syn echo threshold reached. |
source-tcp-syn-dropped-bytes |
uint64 |
Number of bytes dropped after source TCP syn threshold reached. |
source-tcp-syn-ack-dropped-packets |
uint64 |
Number of packets dropped after source TCP syn-ack threshold reached. |
source-tcp-syn-ack-dropped-bytes |
uint64 |
Number of bytes dropped after source TCP syn-ack threshold reached. |
source-tcp-ack-dropped-packets |
uint64 |
Number of packets dropped after source TCP ack threshold reached. |
source-tcp-ack-dropped-bytes |
uint64 |
Number of bytes dropped after source TCP ack threshold reached. |
source-tcp-rst-dropped-packets |
uint64 |
Number of packets dropped after source TCP rst threshold reached. |
source-tcp-rst-dropped-bytes |
uint64 |
Number of bytes dropped after source TCP rst threshold reached. |
source-udp-dns-dropped-packets |
uint64 |
Number of packets dropped after source UDP DNS threshold reached. |
source-udp-dns-dropped-bytes |
uint64 |
Number of bytes dropped after source UDP DNS threshold reached. |
source-udp-quic-dropped-packets |
uint64 |
Number of packets dropped after source UDP QUIC threshold reached. |
source-udp-quic-dropped-bytes |
uint64 |
Number of bytes dropped after source UDP QUIC threshold reached. |
source-udp-raw-dropped-packets |
uint64 |
Number of packets dropped after source UDP raw threshold reached. |
source-udp-raw-dropped-bytes |
uint64 |
Number of bytes dropped after source UDP raw threshold reached. |
dest-icmp-echo-dropped-packets |
uint64 |
Number of packets dropped after dest ICMP echo threshold reached. |
dest-icmp-echo-dropped-bytes |
uint64 |
Number of bytes dropped after dest ICMP echo threshold reached. |
dest-tcp-syn-dropped-packets |
uint64 |
Number of packets dropped after dest TCP syn echo threshold reached. |
dest-tcp-syn-dropped-bytes |
uint64 |
Number of bytes dropped after dest TCP syn threshold reached. |
dest-tcp-syn-ack-dropped-packets |
uint64 |
Number of packets dropped after dest TCP syn-ack threshold reached. |
dest-tcp-syn-ack-dropped-bytes |
uint64 |
Number of bytes dropped after dest TCP syn-ack threshold reached. |
dest-tcp-ack-dropped-packets |
uint64 |
Number of packets dropped after dest TCP ack threshold reached. |
dest-tcp-ack-dropped-bytes |
uint64 |
Number of bytes dropped after dest TCP ack threshold reached. |
dest-tcp-rst-dropped-packets |
uint64 |
Number of packets dropped after dest TCP rst threshold reached. |
dest-tcp-rst-dropped-bytes |
uint64 |
Number of bytes dropped after dest TCP rst threshold reached. |
dest-udp-dns-dropped-packets |
uint64 |
Number of packets dropped after dest UDP DNS threshold reached. |
dest-udp-dns-dropped-bytes |
uint64 |
Number of bytes dropped after dest UDP DNS threshold reached. |
dest-udp-quic-dropped-packets |
uint64 |
Number of packets dropped after dest UDP QUIC threshold reached. |
dest-udp-quic-dropped-bytes |
uint64 |
Number of bytes dropped after dest UDP QUIC threshold reached. |
dest-udp-raw-dropped-packets |
uint64 |
Number of packets dropped after dest UDP raw threshold reached. |
dest-udp-raw-dropped-bytes |
uint64 |
Number of bytes dropped after dest UDP raw threshold reached. |
fp-exceptions-stats
The fast path exceptions statistics.
Measure |
Type |
Description |
|---|---|---|
fast-path-exception-bonding |
uint64 |
Number of packets send in exception in bonding (fp_exception_bonding). |
exception-by-module-fast-path-exception-bonding-cpu-id |
uint16 |
Core ID. |
exception-by-module-fast-path-exception-bonding-cpu-value |
uint64 |
Core statistic. |
fast-path-exception-bridge |
uint64 |
Number of packets send in exception in bridge (fp_exception_bridge). |
exception-by-module-fast-path-exception-bridge-cpu-id |
uint16 |
Core ID. |
exception-by-module-fast-path-exception-bridge-cpu-value |
uint64 |
Core statistic. |
fast-path-exception-ebtables |
uint64 |
Number of packets send in exception in layer 2 filtering (fp_exception_ebtables). |
exception-by-module-fast-path-exception-ebtables-cpu-id |
uint16 |
Core ID. |
exception-by-module-fast-path-exception-ebtables-cpu-value |
uint64 |
Core statistic. |
fast-path-exception-ethernet |
uint64 |
Number of packets send in exception in generic layer 2 (fp_exception_ether). |
exception-by-module-fast-path-exception-ethernet-cpu-id |
uint16 |
Core ID. |
exception-by-module-fast-path-exception-ethernet-cpu-value |
uint64 |
Core statistic. |
fast-path-exception-filtering |
uint64 |
Number of packets send in exception in IPv4 filtering (fp_exception_netfilter). |
exception-by-module-fast-path-exception-filtering-cpu-id |
uint16 |
Core ID. |
exception-by-module-fast-path-exception-filtering-cpu-value |
uint64 |
Core statistic. |
fast-path-exception-filtering-ipv6 |
uint64 |
Number of packets send in exception in IPv6 filtering (fp_exception_netfilter6). |
exception-by-module-fast-path-exception-filtering-ipv6-cpu-id |
uint16 |
Core ID. |
exception-by-module-fast-path-exception-filtering-ipv6-cpu-value |
uint64 |
Core statistic. |
fast-path-exception-gre |
uint64 |
Number of packets send in exception in GRE (fp_exception_gre). |
exception-by-module-fast-path-exception-gre-cpu-id |
uint16 |
Core ID. |
exception-by-module-fast-path-exception-gre-cpu-value |
uint64 |
Core statistic. |
fast-path-exception-ifnet |
uint64 |
Number of packets send in exception by a virtual interface (fp_exception_ifnet). |
exception-by-module-fast-path-exception-ifnet-cpu-id |
uint16 |
Core ID. |
exception-by-module-fast-path-exception-ifnet-cpu-value |
uint64 |
Core statistic. |
fast-path-exception-ip |
uint64 |
Number of packets send in exception in generic IPv4 (fp_exception_ip). |
exception-by-module-fast-path-exception-ip-cpu-id |
uint16 |
Core ID. |
exception-by-module-fast-path-exception-ip-cpu-value |
uint64 |
Core statistic. |
fast-path-exception-ipsec |
uint64 |
Number of packets send in exception in IPv4 IPsec (fp_exception_ipsec). |
exception-by-module-fast-path-exception-ipsec-cpu-id |
uint16 |
Core ID. |
exception-by-module-fast-path-exception-ipsec-cpu-value |
uint64 |
Core statistic. |
fast-path-exception-ipsec-ipv6 |
uint64 |
Number of packets send in exception in IPv6 IPsec (fp_exception_ipsec6). |
exception-by-module-fast-path-exception-ipsec-ipv6-cpu-id |
uint16 |
Core ID. |
exception-by-module-fast-path-exception-ipsec-ipv6-cpu-value |
uint64 |
Core statistic. |
fast-path-exception-ipv6 |
uint64 |
Number of packets send in exception in generic IPv6 (fp_exception_ipv6). |
exception-by-module-fast-path-exception-ipv6-cpu-id |
uint16 |
Core ID. |
exception-by-module-fast-path-exception-ipv6-cpu-value |
uint64 |
Core statistic. |
fast-path-exception-macvlan |
uint64 |
Number of packets send in exception in MACVLAN (fp_exception_macvlan). |
exception-by-module-fast-path-exception-macvlan-cpu-id |
uint16 |
Core ID. |
exception-by-module-fast-path-exception-macvlan-cpu-value |
uint64 |
Core statistic. |
fast-path-exception-mpls |
uint64 |
Number of packets send in exception in MPLS (fp_exception_mpls). |
exception-by-module-fast-path-exception-mpls-cpu-id |
uint16 |
Core ID. |
exception-by-module-fast-path-exception-mpls-cpu-value |
uint64 |
Core statistic. |
fast-path-exception-npf |
uint64 |
Number of packets send in exception in NPF (fp_exception_npf). |
exception-by-module-fast-path-exception-npf-cpu-id |
uint16 |
Core ID. |
exception-by-module-fast-path-exception-npf-cpu-value |
uint64 |
Core statistic. |
fast-path-exception-reassembly |
uint64 |
Number of packets send in exception in IPv4 reassembly (fp_exception_reass). |
exception-by-module-fast-path-exception-reassembly-cpu-id |
uint16 |
Core ID. |
exception-by-module-fast-path-exception-reassembly-cpu-value |
uint64 |
Core statistic. |
fast-path-exception-sflow |
uint64 |
Number of packets sent in exception in sflow (fp_exception_sflow). |
exception-by-module-fast-path-exception-sflow-cpu-id |
uint16 |
Core ID. |
exception-by-module-fast-path-exception-sflow-cpu-value |
uint64 |
Core statistic. |
fast-path-exception-syslog |
uint64 |
Number of packets send in exception for logging (for system without syslog) (fp_exception_syslog). |
exception-by-module-fast-path-exception-syslog-cpu-id |
uint16 |
Core ID. |
exception-by-module-fast-path-exception-syslog-cpu-value |
uint64 |
Core statistic. |
fast-path-exception-tap |
uint64 |
Number of packets send in exception in eBPF (Enhanced Berkeley Packet Filtering), typically when there is a tcpdump or sflow (fp_exception_tap). |
exception-by-module-fast-path-exception-tap-cpu-id |
uint16 |
Core ID. |
exception-by-module-fast-path-exception-tap-cpu-value |
uint64 |
Core statistic. |
fast-path-exception-tunnel |
uint64 |
Number of packets send in exception in IPinIP tunnel (fp_exception_tunnel). |
exception-by-module-fast-path-exception-tunnel-cpu-id |
uint16 |
Core ID. |
exception-by-module-fast-path-exception-tunnel-cpu-value |
uint64 |
Core statistic. |
fast-path-exception-unknown-ifnet |
uint64 |
Number of packets sent in exception due to unknown ifnet (fp_exception_unknown_ifnet). |
exception-by-module-fast-path-exception-unknown-ifnet-cpu-id |
uint16 |
Core ID. |
exception-by-module-fast-path-exception-unknown-ifnet-cpu-value |
uint64 |
Core statistic. |
fast-path-exception-vethernet |
uint64 |
Number of packets sent in exception in vEthernet (fp_exception_veth). |
exception-by-module-fast-path-exception-vethernet-cpu-id |
uint16 |
Core ID. |
exception-by-module-fast-path-exception-vethernet-cpu-value |
uint64 |
Core statistic. |
fast-path-exception-vlan |
uint64 |
Number of packets sent in exception in VLAN (fp_exception_vlan). |
exception-by-module-fast-path-exception-vlan-cpu-id |
uint16 |
Core ID. |
exception-by-module-fast-path-exception-vlan-cpu-value |
uint64 |
Core statistic. |
fast-path-exception-vxlan |
uint64 |
Number of packets send in exception in VXLAN (fp_exception_vxlan). |
exception-by-module-fast-path-exception-vxlan-cpu-id |
uint16 |
Core ID. |
exception-by-module-fast-path-exception-vxlan-cpu-value |
uint64 |
Core statistic. |
exception-dropped-fp-to-linux-add-mark-failure |
uint64 |
Number of exception packets to Linux dropped due to a tag addition failure (ExcpDroppedFpToLinuxAddMarkFailure). |
exception-dropped-fp-to-linux-add-mark-failure-cpu-id |
uint16 |
Core ID. |
exception-dropped-fp-to-linux-add-mark-failure-cpu-value |
uint64 |
Core statistic. |
exception-dropped-fp-to-linux-fptun-failure |
uint64 |
Number of ExcpDroppedFpToLinuxFptunFailure exceptions (ExcpDroppedFpToLinuxFptunFailure). |
exception-dropped-fp-to-linux-fptun-failure-cpu-id |
uint16 |
Core ID. |
exception-dropped-fp-to-linux-fptun-failure-cpu-value |
uint64 |
Core statistic. |
exception-dropped-fp-to-linux-no-ipv4-route-local |
uint64 |
Number of exception packets to Linux dropped due to a failure to find the IPv4 route (ExcpDroppedFpToLinuxNoIPv4RouteLocal). |
exception-dropped-fp-to-linux-no-ipv4-route-local-cpu-id |
uint16 |
Core ID. |
exception-dropped-fp-to-linux-no-ipv4-route-local-cpu-value |
uint64 |
Core statistic. |
exception-dropped-fp-to-linux-no-ipv6-route-local |
uint64 |
Number of exception packets to Linux dropped due to a failure to find the IPv6 route (ExcpDroppedFpToLinuxNoIPv6RouteLocal). |
exception-dropped-fp-to-linux-no-ipv6-route-local-cpu-id |
uint16 |
Core ID. |
exception-dropped-fp-to-linux-no-ipv6-route-local-cpu-value |
uint64 |
Core statistic. |
exception-dropped-fp-to-linux-prepend-failure |
uint64 |
Number of ExcpDroppedFpToLinuxPrependFailure exceptions (ExcpDroppedFpToLinuxPrependFailure). |
exception-dropped-fp-to-linux-prepend-failure-cpu-id |
uint16 |
Core ID. |
exception-dropped-fp-to-linux-prepend-failure-cpu-value |
uint64 |
Core statistic. |
exception-dropped-fp-to-linux-ecmp-prepend-failure |
uint64 |
Number of ExcpDroppedFpToLinuxEcmpPrependFailure exceptions (ExcpDroppedFpToLinuxEcmpPrependFailure). |
exception-dropped-fp-to-linux-prepend-failure-detailed-exception-dropped-fp-to-linux-ecmp-prepend-failure-cpu-id |
uint16 |
Core ID. |
exception-dropped-fp-to-linux-prepend-failure-detailed-exception-dropped-fp-to-linux-ecmp-prepend-failure-cpu-value |
uint64 |
Core statistic. |
exception-dropped-fp-to-linux-ecmp6-prepend-failure |
uint64 |
Number of ExcpDroppedFpToLinuxEcmp6PrependFailure exceptions (ExcpDroppedFpToLinuxEcmp6PrependFailure). |
exception-dropped-fp-to-linux-prepend-failure-detailed-exception-dropped-fp-to-linux-ecmp6-prepend-failure-cpu-id |
uint16 |
Core ID. |
exception-dropped-fp-to-linux-prepend-failure-detailed-exception-dropped-fp-to-linux-ecmp6-prepend-failure-cpu-value |
uint64 |
Core statistic. |
exception-dropped-fp-to-linux-eth-fptun-prepend-failure |
uint64 |
Number of ExcpDroppedFpToLinuxEthFptunPrependFailure exceptions (ExcpDroppedFpToLinuxEthFptunPrependFailure). |
exception-dropped-fp-to-linux-prepend-failure-detailed-exception-dropped-fp-to-linux-eth-fptun-prepend-failure-cpu-id |
uint16 |
Core ID. |
exception-dropped-fp-to-linux-prepend-failure-detailed-exception-dropped-fp-to-linux-eth-fptun-prepend-failure-cpu-value |
uint64 |
Core statistic. |
exception-dropped-fp-to-linux-eth-prepend-failure |
uint64 |
Number of ExcpDroppedFpToLinuxEthPrependFailure exceptions (ExcpDroppedFpToLinuxEthPrependFailure). |
exception-dropped-fp-to-linux-prepend-failure-detailed-exception-dropped-fp-to-linux-eth-prepend-failure-cpu-id |
uint16 |
Core ID. |
exception-dropped-fp-to-linux-prepend-failure-detailed-exception-dropped-fp-to-linux-eth-prepend-failure-cpu-value |
uint64 |
Core statistic. |
exception-dropped-fp-to-linux-ipsec-prepend-failure |
uint64 |
Number of ExcpDroppedFpToLinuxIPsecPrependFailure exceptions (ExcpDroppedFpToLinuxIPsecPrependFailure). |
exception-dropped-fp-to-linux-prepend-failure-detailed-exception-dropped-fp-to-linux-ipsec-prepend-failure-cpu-id |
uint16 |
Core ID. |
exception-dropped-fp-to-linux-prepend-failure-detailed-exception-dropped-fp-to-linux-ipsec-prepend-failure-cpu-value |
uint64 |
Core statistic. |
exception-dropped-fp-to-linux-restore-failure |
uint64 |
Number of ExcpDroppedFpToLinuxRestoreFailure exceptions (ExcpDroppedFpToLinuxRestoreFailure). |
exception-dropped-fp-to-linux-prepend-failure-detailed-exception-dropped-fp-to-linux-restore-failure-cpu-id |
uint16 |
Core ID. |
exception-dropped-fp-to-linux-prepend-failure-detailed-exception-dropped-fp-to-linux-restore-failure-cpu-value |
uint64 |
Core statistic. |
exception-dropped-fp-to-linux-tuple-prepend-failure |
uint64 |
Number of ExcpDroppedFpToLinuxTuplePrependFailure exceptions (ExcpDroppedFpToLinuxTuplePrependFailure). |
exception-dropped-fp-to-linux-prepend-failure-detailed-exception-dropped-fp-to-linux-tuple-prepend-failure-cpu-id |
uint16 |
Core ID. |
exception-dropped-fp-to-linux-prepend-failure-detailed-exception-dropped-fp-to-linux-tuple-prepend-failure-cpu-value |
uint64 |
Core statistic. |
exception-dropped-invalid-mtag |
uint64 |
Number of ExcpDroppedInvalidMtag exceptions (ExcpDroppedInvalidMtag). |
exception-dropped-invalid-mtag-cpu-id |
uint16 |
Core ID. |
exception-dropped-invalid-mtag-cpu-value |
uint64 |
Core statistic. |
exception-dropped-linux-to-fp-generic-command-failure |
uint64 |
Number of packets from Linux dropped due to a FPTUN internal error (ExcpDroppedLinuxToFpGenericCommandFailure). |
exception-dropped-linux-to-fp-generic-command-failure-cpu-id |
uint16 |
Core ID. |
exception-dropped-linux-to-fp-generic-command-failure-cpu-value |
uint64 |
Core statistic. |
exception-dropped-linux-to-fp-invalid-port-id |
uint64 |
Number of packets from Linux dropped due to a reception of a FPTUN message on an unexpected port (ExcpDroppedLinuxToFpInvalidPortId). |
exception-dropped-linux-to-fp-invalid-port-id-cpu-id |
uint16 |
Core ID. |
exception-dropped-linux-to-fp-invalid-port-id-cpu-value |
uint64 |
Core statistic. |
exception-dropped-linux-to-fp-invalid-version |
uint64 |
Number of packets from Linux dropped due to an invalid FPTUN version (ExcpDroppedLinuxToFpInvalidVersion). |
exception-dropped-linux-to-fp-invalid-version-cpu-id |
uint16 |
Core ID. |
exception-dropped-linux-to-fp-invalid-version-cpu-value |
uint64 |
Core statistic. |
exception-dropped-linux-to-fp-ipv4-pullup-failure |
uint64 |
Number of packets from Linux dropped due to a failure when getting the IPv4 header of the FPTUN message (ExcpDroppedLinuxToFpIPv4PullupFailure). |
exception-dropped-linux-to-fp-ipv4-pullup-failure-cpu-id |
uint16 |
Core ID. |
exception-dropped-linux-to-fp-ipv4-pullup-failure-cpu-value |
uint64 |
Core statistic. |
exception-dropped-linux-to-fp-ipv6-pullup-failure |
uint64 |
Number of packets from Linux dropped due to a failure when getting the IPv6 header of the FPTUN message (ExcpDroppedLinuxToFpIPv6PullupFailure). |
exception-dropped-linux-to-fp-ipv6-pullup-failure-cpu-id |
uint16 |
Core ID. |
exception-dropped-linux-to-fp-ipv6-pullup-failure-cpu-value |
uint64 |
Core statistic. |
exception-dropped-linux-to-fp-msg-too-short |
uint64 |
Number of packets from Linux dropped due to an incomplete FPTUN message (ExcpDroppedLinuxToFpMsgTooShort). |
exception-dropped-linux-to-fp-msg-too-short-cpu-id |
uint16 |
Core ID. |
exception-dropped-linux-to-fp-msg-too-short-cpu-value |
uint64 |
Core statistic. |
exception-dropped-linux-to-fp-no-output-function |
uint64 |
Number of packets from Linux dropped because no TX function has been registered (ExcpDroppedLinuxToFpNoOutputFunction). |
exception-dropped-linux-to-fp-no-output-function-cpu-id |
uint16 |
Core ID. |
exception-dropped-linux-to-fp-no-output-function-cpu-value |
uint64 |
Core statistic. |
exception-dropped-linux-to-fp-other-host |
uint64 |
Number of packets from Linux dropped due to a reception of a FPTUN message marked as PACKET_OTHERHOST (ExcpDroppedLinuxToFpOtherHost). |
exception-dropped-linux-to-fp-other-host-cpu-id |
uint16 |
Core ID. |
exception-dropped-linux-to-fp-other-host-cpu-value |
uint64 |
Core statistic. |
exception-dropped-linux-to-fp-out-operative |
uint64 |
Number of packets from Linux dropped because the destination interface is down (ExcpDroppedLinuxToFpOutOperative). |
exception-dropped-linux-to-fp-out-operative-cpu-id |
uint16 |
Core ID. |
exception-dropped-linux-to-fp-out-operative-cpu-value |
uint64 |
Core statistic. |
exception-dropped-linux-to-fp-tproxy-failure |
uint64 |
Number of ExcpDroppedLinuxToFpTproxyFailure exceptions (ExcpDroppedLinuxToFpTproxyFailure). |
exception-dropped-linux-to-fp-tproxy-failure-cpu-id |
uint16 |
Core ID. |
exception-dropped-linux-to-fp-tproxy-failure-cpu-value |
uint64 |
Core statistic. |
exception-dropped-linux-to-fp-unknown-command |
uint64 |
Number of packets from Linux dropped due to an invalid FPTUN command (ExcpDroppedLinuxToFpUnknownCommand). |
exception-dropped-linux-to-fp-unknown-command-cpu-id |
uint16 |
Core ID. |
exception-dropped-linux-to-fp-unknown-command-cpu-value |
uint64 |
Core statistic. |
exception-dropped-linux-to-fp-unknown-interface-uid |
uint64 |
Number of packets from Linux dropped due to an invalid interface id for FPTUN (ExcpDroppedLinuxToFpUnknownIfUid). |
exception-dropped-linux-to-fp-unknown-interface-uid-cpu-id |
uint16 |
Core ID. |
exception-dropped-linux-to-fp-unknown-interface-uid-cpu-value |
uint64 |
Core statistic. |
exception-dropped-no-conntrack |
uint64 |
Number of ExcpDroppedNoConntrack exceptions (ExcpDroppedNoConntrack). |
exception-dropped-no-conntrack-cpu-id |
uint16 |
Core ID. |
exception-dropped-no-conntrack-cpu-value |
uint64 |
Core statistic. |
local-basic-exceptions |
uint64 |
The number of local basic exceptions (LocalBasicExceptions). |
local-basic-exceptions-cpu-id |
uint16 |
Core ID. |
local-basic-exceptions-cpu-value |
uint64 |
Core statistic. |
fptun-exception-ether-dst |
uint64 |
The number of FPTUN_EXC_ETHER_DST exceptions (FPTUN_EXC_ETHER_DST). |
local-exception-class-fptun-exception-ether-dst-cpu-id |
uint16 |
Core ID. |
local-exception-class-fptun-exception-ether-dst-cpu-value |
uint64 |
Core statistic. |
fptun-exception-icmp-needed |
uint64 |
The number of FPTUN_EXC_ICMP_NEEDED exceptions (FPTUN_EXC_ICMP_NEEDED). |
local-exception-class-fptun-exception-icmp-needed-cpu-id |
uint16 |
Core ID. |
local-exception-class-fptun-exception-icmp-needed-cpu-value |
uint64 |
Core statistic. |
fptun-exception-ike-needed |
uint64 |
The number of FPTUN_EXC_IKE_NEEDED exceptions (FPTUN_EXC_IKE_NEEDED). |
local-exception-class-fptun-exception-ike-needed-cpu-id |
uint16 |
Core ID. |
local-exception-class-fptun-exception-ike-needed-cpu-value |
uint64 |
Core statistic. |
fptun-exception-ip-dst |
uint64 |
The number of FPTUN_EXC_IP_DST exceptions (FPTUN_EXC_IP_DST). |
local-exception-class-fptun-exception-ip-dst-cpu-id |
uint16 |
Core ID. |
local-exception-class-fptun-exception-ip-dst-cpu-value |
uint64 |
Core statistic. |
fptun-exception-ndisc-needed |
uint64 |
The number of FPTUN_EXC_NDISC_NEEDED exceptions (FPTUN_EXC_NDISC_NEEDED). |
local-exception-class-fptun-exception-ndisc-needed-cpu-id |
uint16 |
Core ID. |
local-exception-class-fptun-exception-ndisc-needed-cpu-value |
uint64 |
Core statistic. |
fptun-exception-nf-func |
uint64 |
The number of FPTUN_EXC_NF_FUNC exceptions (FPTUN_EXC_NF_FUNC). |
local-exception-class-fptun-exception-nf-func-cpu-id |
uint16 |
Core ID. |
local-exception-class-fptun-exception-nf-func-cpu-value |
uint64 |
Core statistic. |
fptun-exception-sp-func |
uint64 |
The number of FPTUN_EXC_SP_FUNC exceptions (FPTUN_EXC_SP_FUNC). |
local-exception-class-fptun-exception-sp-func-cpu-id |
uint16 |
Core ID. |
local-exception-class-fptun-exception-sp-func-cpu-value |
uint64 |
Core statistic. |
fptun-exception-tap |
uint64 |
The number of FPTUN_EXC_TAP exceptions (FPTUN_EXC_TAP). |
local-exception-class-fptun-exception-tap-cpu-id |
uint16 |
Core ID. |
local-exception-class-fptun-exception-tap-cpu-value |
uint64 |
Core statistic. |
fptun-exception-undef |
uint64 |
The number of FPTUN_EXC_UNDEF exceptions (FPTUN_EXC_UNDEF). |
local-exception-class-fptun-exception-undef-cpu-id |
uint16 |
Core ID. |
local-exception-class-fptun-exception-undef-cpu-value |
uint64 |
Core statistic. |
fptun-basic-exception |
uint64 |
Number of basic exception packets for Linux reception processing (FPTUN_BASIC_EXCEPT). |
local-exception-type-fptun-basic-exception-cpu-id |
uint16 |
Core ID. |
local-exception-type-fptun-basic-exception-cpu-value |
uint64 |
Core statistic. |
fptun-eth-input-exception |
uint64 |
Number of FPTUN exception packets for Linux ethernet input processing (FPTUN_ETH_INPUT_EXCEPT). |
local-exception-type-fptun-eth-input-exception-cpu-id |
uint16 |
Core ID. |
local-exception-type-fptun-eth-input-exception-cpu-value |
uint64 |
Core statistic. |
fptun-eth-sp-output-req |
uint64 |
Number of FPTUN exception packets from Linux for fast path ethernet processing (FPTUN_ETH_SP_OUTPUT_REQ). |
local-exception-type-fptun-eth-sp-output-req-cpu-id |
uint16 |
Core ID. |
local-exception-type-fptun-eth-sp-output-req-cpu-value |
uint64 |
Core statistic. |
fptun-iface-input-exception |
uint64 |
Number of FPTUN exception packets for Linux VNB iface processing (FPTUN_IFACE_INPUT_EXCEPT). |
local-exception-type-fptun-iface-input-exception-cpu-id |
uint16 |
Core ID. |
local-exception-type-fptun-iface-input-exception-cpu-value |
uint64 |
Core statistic. |
fptun-ipsec-sp-output-req |
uint64 |
Number of FPTUN exception packets from Linux for fast path IPsec processing (FPTUN_IPSEC_SP_OUTPUT_REQ). |
local-exception-type-fptun-ipsec-sp-output-req-cpu-id |
uint16 |
Core ID. |
local-exception-type-fptun-ipsec-sp-output-req-cpu-value |
uint64 |
Core statistic. |
fptun-ipv4-ipsecdone-input-exception |
uint64 |
Number of FPTUN exception packets for Linux IPv4 input after IPsec processing (FPTUN_IPV4_IPSECDONE_INPUT_EXCEPT). |
local-exception-type-fptun-ipv4-ipsecdone-input-exception-cpu-id |
uint16 |
Core ID. |
local-exception-type-fptun-ipv4-ipsecdone-input-exception-cpu-value |
uint64 |
Core statistic. |
fptun-ipv4-ipsecdone-output-exception |
uint64 |
Number of FPTUN exception packets for Linux IPv4 output after IPsec processing (FPTUN_IPV4_IPSECDONE_OUTPUT_EXCEPT). |
local-exception-type-fptun-ipv4-ipsecdone-output-exception-cpu-id |
uint16 |
Core ID. |
local-exception-type-fptun-ipv4-ipsecdone-output-exception-cpu-value |
uint64 |
Core statistic. |
fptun-ipv4-natdone-input-exception |
uint64 |
Number of FPTUN exception packets for Linux IPv4 input after NAT processing (FPTUN_IPV4_NATDONE_INPUT_EXCEPT). |
local-exception-type-fptun-ipv4-natdone-input-exception-cpu-id |
uint16 |
Core ID. |
local-exception-type-fptun-ipv4-natdone-input-exception-cpu-value |
uint64 |
Core statistic. |
fptun-ipv4-output-exception |
uint64 |
Number of FPTUN exception packets for Linux IPv4 output (FPTUN_IPV4_OUTPUT_EXCEPT). |
local-exception-type-fptun-ipv4-output-exception-cpu-id |
uint16 |
Core ID. |
local-exception-type-fptun-ipv4-output-exception-cpu-value |
uint64 |
Core statistic. |
fptun-ipv4-sp-output-req |
uint64 |
Number of FPTUN exception packets from Linux for fast path IPv4 processing (FPTUN_IPV4_SP_OUTPUT_REQ). |
local-exception-type-fptun-ipv4-sp-output-req-cpu-id |
uint16 |
Core ID. |
local-exception-type-fptun-ipv4-sp-output-req-cpu-value |
uint64 |
Core statistic. |
fptun-ipv6-ipsecdone-input-exception |
uint64 |
Number of FPTUN exception packets for Linux IPv6 input after IPsec processing (FPTUN_IPV6_IPSECDONE_INPUT_EXCEPT). |
local-exception-type-fptun-ipv6-ipsecdone-input-exception-cpu-id |
uint16 |
Core ID. |
local-exception-type-fptun-ipv6-ipsecdone-input-exception-cpu-value |
uint64 |
Core statistic. |
fptun-ipv6-ipsecdone-output-exception |
uint64 |
Number of FPTUN exception packets for Linux IPv6 output after IPsec processing (FPTUN_IPV6_IPSECDONE_OUTPUT_EXCEPT). |
local-exception-type-fptun-ipv6-ipsecdone-output-exception-cpu-id |
uint16 |
Core ID. |
local-exception-type-fptun-ipv6-ipsecdone-output-exception-cpu-value |
uint64 |
Core statistic. |
fptun-ipv6-output-exception |
uint64 |
Number of FPTUN exception packets for Linux IPv6 output (FPTUN_IPV6_OUTPUT_EXCEPT). |
local-exception-type-fptun-ipv6-output-exception-cpu-id |
uint16 |
Core ID. |
local-exception-type-fptun-ipv6-output-exception-cpu-value |
uint64 |
Core statistic. |
fptun-ipv6-sp-output-req |
uint64 |
Number of FPTUN exception packets from Linux for fast path IPv6 processing (FPTUN_IPV6_SP_OUTPUT_REQ). |
local-exception-type-fptun-ipv6-sp-output-req-cpu-id |
uint16 |
Core ID. |
local-exception-type-fptun-ipv6-sp-output-req-cpu-value |
uint64 |
Core statistic. |
fptun-output-exception |
uint64 |
Number of FPTUN exception packets for Linux interface output processing (FPTUN_OUTPUT_EXCEPT). |
local-exception-type-fptun-output-exception-cpu-id |
uint16 |
Core ID. |
local-exception-type-fptun-output-exception-cpu-value |
uint64 |
Core statistic. |
fptun-tap |
uint64 |
Number of FPTUN exception packets for Linux TAP (tcpdump) (FPTUN_TAP). |
local-exception-type-fptun-tap-cpu-id |
uint16 |
Core ID. |
local-exception-type-fptun-tap-cpu-value |
uint64 |
Core statistic. |
local-fptun-exceptions |
uint64 |
The number of local fptun exceptions (LocalFPTunExceptions). |
local-fptun-exceptions-cpu-id |
uint16 |
Core ID. |
local-fptun-exceptions-cpu-value |
uint64 |
Core statistic. |
fp-filling
The fast path filling.
Measure |
Type |
Description |
|---|---|---|
interfaces-current |
uint32 |
Current number of interfaces. It includes physical ports and virtual interfaces like gre, vlan, … |
vrf-current |
uint32 |
Current number of VRFs. |
neighbors-current |
uint32 |
Current number of IPv4 and IPv6 neighbors. |
ip-cur-nexthop |
uint32 |
Current number of nexthop entries. |
ip-cur-nexthop-groups |
uint32 |
Current number of nexthop groups. |
ip4-cur-addr |
uint32 |
Current number of IPv4 addresses. |
routes-ipv4-current |
uint32 |
Current number of IPv4 routes. |
ip6-cur-addr |
uint32 |
Current number of IPv6 addresses. |
routes-ipv6-current |
uint32 |
Current number of IPv6 routes. |
pbr-rules-current |
uint32 |
Current number of PBR rules. |
filter-ipv4-rules-current |
uint32 |
Current number of IPv4 Netfilter rules. |
filter-ipv6-rules-current |
uint32 |
Current number of IPv6 Netfilter rules. |
conntracks-ipv4-current |
uint32 |
Current number of IPv4 Netfilter conntracks. |
conntracks-ipv6-current |
uint32 |
Current number of IPv6 Netfilter conntracks. |
ipsets-current |
uint32 |
Current number of ipsets per VRF. |
vxlan-port-current |
uint32 |
Current number of (VXLAN destination port, VRF) pairs. |
vxlan-interfaces-current |
uint32 |
Current number of VXLAN interfaces. |
vxlan-fdb-current |
uint32 |
Current number of VXLAN forwarding database entries. |
ipsec-sp-current |
uint32 |
Current number of IPv4 and IPv6 IPsec SPs. |
ipsec-sa-current |
uint32 |
Current number of IPv4 and IPv6 IPsec SAs. |
ip-cur-lpm-table |
uint32 |
Current number of IPv4 and IPv6 tables. |
ip-lpm-memory-current |
uint32 |
Current amount of memory reserved for IPv4 and IPv6 LPM tree. |
vlan-interfaces-current |
uint32 |
Current number of VLAN interfaces. |
vlan-lower-cur-if |
uint32 |
Current number of interfaces supporting one or more vlan(s). |
macvlan-interfaces-current |
uint32 |
Current number of MACVLAN (VRRP) interfaces. |
gre-interfaces-current |
uint32 |
Current number of GRE interfaces. |
svti-interfaces-current |
uint32 |
Current number of SVTI interfaces. |
pppoe-sessions-current |
uint32 |
Current number of PPPoE interfaces. |
pppol2tp-sessions-current |
uint32 |
Current number of PPPoL2TP data sessions. |
ipoe-sessions-current |
uint32 |
Current number of IPoE sessions. |
mpls-cur-route |
uint32 |
Current number of pure MPLS routes. |
mpls-cur-lwt |
uint32 |
Current number of MPLS lightweight tunnels. One is needed for each IP route doing MPLS encapsulation. |
qos-sched-current |
uint32 |
Current number of interfaces with QoS enabled. |
qos-classifier-current |
uint32 |
Current number of QoS classifiers. |
qos-queue-current |
uint32 |
Current number of QoS queues. |
qos-cur-policies |
uint32 |
Current number of QoS policies. |
qos-cur-selectors |
uint32 |
Current number of QoS selectors. |
bridge-interfaces-current |
uint32 |
Current number of bridge interfaces. |
bridge-ports-current |
uint32 |
Current number of bridge slave ports. |
bridge-fdb-current |
uint32 |
Current number of bridge forwarding database entries. |
fp-conntracks-current |
uint32 |
Current number of fast-path firewall conntracks. |
gtp-interfaces-current |
uint32 |
Current number of GTP interfaces. |
gtp-pdp-current |
uint32 |
Current number of GTP tunnels. |
gtp-qos-flow-current |
uint32 |
Current number of GTP QoS flows. |
gtp-qos-policy-current |
uint32 |
Current number of GTP QoS policies. |
tc-cur-policers |
uint32 |
Current number of tc policers. |
pmtud-cur-entries |
uint32 |
Current number of pmtud cached entries. |
lawful-interception-cur |
uint32 |
Current number of lawful interceptions. |
interfaces-max |
uint32 |
Maximum number of interfaces. It includes physical ports and virtual interfaces like gre, vlan, … |
vrf-max |
uint32 |
Maximum number of VRFs. |
neighbors-max |
uint32 |
Maximum number of IP neighbors. |
ip-max-nexthop |
uint32 |
Maximum number of nexthop entries. |
ip-max-nexthop-groups |
uint32 |
Maximum number of nexthop groups. |
ip4-max-addr |
uint32 |
Maximum number of IPv4 addresses. |
routes-ipv4-max |
uint32 |
Maximum number of IPv4 routes. |
ip6-max-addr |
uint32 |
Maximum number of IPv6 addresses. |
routes-ipv6-max |
uint32 |
Maximum number of IPv6 routes. |
pbr-rules-max |
uint32 |
Maximum number of PBR rules. |
filter-ipv4-rules-max |
uint32 |
Maximum number of IPv4 Netfilter rules. |
filter-ipv6-rules-max |
uint32 |
Maximum number of IPv6 Netfilter rules. |
conntracks-ipv4-max |
uint32 |
Maximum number of IPv4 Netfilter conntracks. |
conntracks-ipv6-max |
uint32 |
Maximum number of IPv6 Netfilter conntracks. |
filter-max-ipset |
uint32 |
Maximum number of ipsets per VRF. |
ipsets-max |
uint32 |
Maximum number of entries per ipset. |
filterbridge-rules-max |
uint32 |
Maximum number of bridge filter rules. |
vxlan-port-max |
uint32 |
Maximum number of (VXLAN destination port, VRF) pairs. |
vxlan-interfaces-max |
uint32 |
Maximum number of VXLAN interfaces. |
vxlan-fdb-max |
uint32 |
Maximum number of VXLAN forwarding database entries. |
reass4-max-queue |
uint32 |
Maximum number of simultaneous reassembly procedures for IPv4. |
reass6-max-queue |
uint32 |
Maximum number of simultaneous reassembly procedures for IPv6. |
ipsec-sp-max |
uint32 |
Maximum number of IPv4 and IPv6 IPsec SPs. |
ipsec-sp-hash-slots |
uint32 |
Number of slots in the IPsec SP hash table. The actual number of slots is rounded to the next power of two. |
ipsec-sa-max |
uint32 |
Maximum number of IPv4 and IPv6 IPsec SAs. |
ipsec-sa-hash-slots |
uint32 |
Number of slots in the IPsec SA hash table. The actual number of slots is rounded to the next power of two. |
ip-max-lpm-table |
uint32 |
Maximum number of IPv4 and IPv6 tables. |
ip-lpm-memory-max |
uint32 |
Amount of memory reserved for IPv4 and IPv6 LPM tree. |
filter-max-cache |
uint32 |
Maximum number of IPv4 flows stored in filter cache. |
filter6-max-cache |
uint32 |
Maximum number of IPv6 flows stored in filter cache. |
vlan-interfaces-max |
uint32 |
Maximum number of VLAN interfaces. |
vlan-lower-max-if |
uint32 |
Maximum number of interfaces supporting one or more vlan(s). |
macvlan-interfaces-max |
uint32 |
Maximum number of MACVLAN (VRRP) interfaces. |
gre-interfaces-max |
uint32 |
Maximum number of GRE interfaces. |
svti-interfaces-max |
uint32 |
Maximum number of SVTI interfaces. |
pppoe-sessions-max |
uint32 |
Maximum number of PPPoE channels. |
ipoe-sessions-max |
uint32 |
Maximum number of IPoE sessions. |
pppol2tp-sessions-max |
uint32 |
Maximum number of PPPoL2TP data sessions. |
mpls-max-label |
uint8 |
Maximum number of MPLS labels in a route. |
mpls-max-route |
uint32 |
Maximum number of pure MPLS routes. |
mpls-max-lwt |
uint32 |
Maximum number of MPLS lightweight tunnels. One is needed for each IP route doing MPLS encapsulation. |
qos-sched-max |
uint32 |
Maximum number of interfaces with QoS enabled. |
qos-classifier-max |
uint32 |
Maximum number of QoS classifier. |
qos-queue-max |
uint32 |
Maximum number of QoS queues. |
qos-max-policies |
uint32 |
Maximum number of QoS policies. |
qos-max-selectors |
uint32 |
Maximum number of QoS selectors. |
qos-max-packets |
uint32 |
Maximum number of packets in the QoS. |
bridge-interfaces-max |
uint32 |
Maximum number of bridge interfaces. |
bridge-ports-max |
uint32 |
Maximum number of bridge slave ports. |
bridge-fdb-max |
uint32 |
Maximum number of bridge forwarding database entries. |
fp-conntracks-max |
uint32 |
Maximum number of fast-path firewall conntracks. |
gtp-interfaces-max |
uint32 |
Maximum number of GTP interfaces. |
gtp-pdp-max |
uint32 |
Maximum number of GTP tunnels the data plane can handle. |
gtp-max-pdp-buffer |
uint32 |
Maximum number of packet to buffer per GTP tunnel. |
gtp-qos-flow-max |
uint32 |
Maximum number of QoS policies that can be allocated globally. |
gtp-qos-policy-max |
uint32 |
Maximum number of GTP QoS policies that can be allocated globally. |
tc-max-policers |
uint32 |
Maximum number of tc policers. |
pmtud-max-entries |
uint32 |
Maximum number of path MTU discovery cache entries that can be allocated globally. |
lawful-interception-max |
uint32 |
Maximum number of Lawful Interceptions. |
cgnat-nats-max |
uint32 |
Maximum number of NAT translations. |
cgnat-users-max |
uint32 |
Maximum number of users. |
cgnat-blocks-max |
uint32 |
Maximum number of blocks. |
cg-nat-min-block-size |
uint32 |
Minimun number of ports per block. |
cg-nat-max-block-size |
uint32 |
Maximum number of ports per block. |
cg-nat-max-pools |
uint32 |
Maximum number of pools. |
cg-nat-max-rules |
uint32 |
Maximum number of rules. |
cg-nat-max-block-translation-ips |
uint32 |
Maximum number of IPs translation for block allocation mode. |
cg-nat-max-port-translation-ips |
uint32 |
Maximum number of IPs translation for port allocation mode. |
cg-nat-max-port-overloading-factor |
enumeration |
Maximum port factor multiplier supported. |
cg-nat-nb-event-threads |
uint8 |
Number of logging threads. These threads collect events and send logs to the servers. Increasing this number allows more logs to be processed per second. |
cgnat-nats-current |
uint32 |
Current number of NAT translations. |
cgnat-users-current |
uint32 |
Current number of users. |
cgnat-blocks-current |
uint32 |
Current number of blocks. |
cg-nat-cur-pools |
uint32 |
Current number of pools. |
cg-nat-cur-rules |
uint32 |
Current number of rules. |
cg-nat-cur-block-translation-ips |
uint32 |
Current number IPs translation for block allocation mode. |
cg-nat-cur-port-translation-ips |
uint32 |
Current number IPs translation for port allocation mode. |
ddos-entries-current |
uint32 |
Current number of DDoS monitored IP addresses. |
ddos-entries-max |
uint32 |
Maximum number of DDoS monitored IP addresses. |
fp-firewall-max-rules |
uint32 |
Maximum number of rules. |
fp-firewall-max-network-groups |
uint32 |
Maximun number of network groups. |
fp-firewall-max-networks |
uint32 |
Maximun number of networks. |
fp-firewall-max-applications |
uint32 |
Maximun number of applications. |
fp-firewall-cur-rules |
uint32 |
Current number of rules. |
fp-firewall-cur-network-groups |
uint32 |
Current number of network groups. |
fp-firewall-cur-networks |
uint32 |
Current number of networks. |
fp-firewall-cur-applications |
uint32 |
Current number of applications. |
ipfix-ipfix-cur-flows |
uint32 |
Current number of IPFIX flows that can be collected between two collector polls. |
ipfix-ipfix-max-flows |
uint32 |
Maximum amount of IPFIX flows that can be collected between two collector polls. |
ipfix-ipfix-cur-probes |
uint32 |
Current number of IPFIX probes that are connected. |
ipfix-ipfix-max-probes |
uint32 |
Maximum amount of IPFIX probes that could simultaneously be connected. |
fp-firewall-stats
The fast path firewall statistics (requires Firewall license).
Measure |
Type |
Description |
|---|---|---|
rule-accepted-packets |
uint64 |
Number of packets accepted by matching a rule. |
conntrack-accepted-packets |
uint64 |
Number of packets accepted by matching a conntrack. |
default-dropped-packets |
uint64 |
Number of packets dropped for not matching any rules. |
rule-dropped-packets |
uint64 |
Number of packets dropped by a rule. |
set-mark-actions |
uint64 |
Number of set mark actions. |
set-mss-actions |
uint64 |
Number of set MSS actions. |
set-dscp-actions |
uint64 |
Number of set DSCP actions. |
save-dscp-actions |
uint64 |
Number of save DSCP actions. |
restore-dscp-actions |
uint64 |
Number of restore DSCP actions. |
conntrack-based-routing-actions |
uint64 |
Number of conntrack-based-routing actions. |
ha-fp-conntrack-stats
The CG-NAT and firewall High Availability statistics.
Measure |
Type |
Description |
|---|---|---|
synchronization-event-transmissions |
uint64 |
Number of synchronization events successfully transmitted to HA peers. |
synchronization-event-transmission-failures |
uint64 |
Number of synchronization events failed to be transmitted to HA peers. |
synchronization-event-build-failures |
uint64 |
Number of synchronization event build failures. |
synchronization-event-received |
uint64 |
Number of synchronization events successfully received. |
synchronization-event-invalid-format-received |
uint64 |
Number of synchronization events received with invalid format. |
synchronization-event-parsing-failures |
uint64 |
Number of synchronization event parsing failures. |
synchronization-event-partially-received |
uint64 |
Number of synchronization events partially received. |
synchronization-event-create-connections |
uint64 |
Number of connections created from synchronization events. |
synchronization-event-create-connection-failures |
uint64 |
Number of connection creation failures from synchronization events. |
synchronization-event-create-connection-nat-failures |
uint64 |
Number of connection creation with NAT mapping failures from synchronization events. |
synchronization-event-create-connection-races |
uint64 |
Number of connection creation races from synchronization events. |
synchronization-event-update-connections |
uint64 |
Number of connections updated from synchronization events. |
synchronization-event-update-connections-missing |
uint64 |
Number of update failures due to missing connections from synchronization events. |
synchronization-event-destroy-connections |
uint64 |
Number of connections destroyed from synchronization events. |
synchronization-event-destroy-connections-missing |
uint64 |
Number of destroy failures due to missing connections from synchronization events. |
fp-event-stats
The fast path log and HA events statistics.
Measure |
Type |
Description |
|---|---|---|
event-enqueues-to-event-threads |
uint64 |
Number of events enqueued to event threads. |
event-enqueue-failures-to-event-threads |
uint64 |
Number of events enqueue failures to event threads. |
event-enqueue-retries-to-event-threads |
uint64 |
Number of events enqueue retries to event threads. |
event-enqueues-to-dataplane-threads |
uint64 |
Number of events enqueued to dataplane threads. |
event-enqueue-retries-to-dataplane-threads |
uint64 |
Number of events enqueue retries to dataplane threads. |
fp-global-stats
The fast path global drop statistics.
Measure |
Type |
Description |
|---|---|---|
fast-path-dropped |
uint64 |
Number of packets dropped by fast path (fp_dropped). |
fast-path-dropped-cpu-id |
uint16 |
Core ID. |
fast-path-dropped-cpu-value |
uint64 |
Core statistic. |
fast-path-dropped-neighbor |
uint64 |
Number of packets dropped by fast path in ARP/NDP (fp_dropped_neigh). |
fast-path-dropped-neighbor-cpu-id |
uint16 |
Core ID. |
fast-path-dropped-neighbor-cpu-value |
uint64 |
Core statistic. |
fast-path-dropped-bonding |
uint64 |
Number of packets dropped by fast path in bonding (fp_dropped_bonding). |
fast-path-dropped-bonding-cpu-id |
uint16 |
Core ID. |
fast-path-dropped-bonding-cpu-value |
uint64 |
Core statistic. |
fast-path-dropped-bridge |
uint64 |
Number of packets dropped by fast path in bridge (fp_dropped_bridge). |
fast-path-dropped-bridge-cpu-id |
uint16 |
Core ID. |
fast-path-dropped-bridge-cpu-value |
uint64 |
Core statistic. |
fast-path-dropped-ebtables |
uint64 |
Number of packets dropped by fast path in layer 2 filtering (fp_dropped_ebtables). |
fast-path-dropped-ebtables-cpu-id |
uint16 |
Core ID. |
fast-path-dropped-ebtables-cpu-value |
uint64 |
Core statistic. |
fast-path-dropped-ethernet |
uint64 |
Number of packets dropped by fast path at the generic ethernet layer (fp_dropped_ether). |
fast-path-dropped-ethernet-cpu-id |
uint16 |
Core ID. |
fast-path-dropped-ethernet-cpu-value |
uint64 |
Core statistic. |
fast-path-dropped-exception |
uint64 |
Number of packets dropped by fast path in exception path (fp_dropped_excp). |
fast-path-dropped-exception-cpu-id |
uint16 |
Core ID. |
fast-path-dropped-exception-cpu-value |
uint64 |
Core statistic. |
fast-path-dropped-exception-loop |
uint64 |
Number of packets dropped by fast path due to exception loop (fp_dropped_excloop). |
fast-path-dropped-exception-loop-cpu-id |
uint16 |
Core ID. |
fast-path-dropped-exception-loop-cpu-value |
uint64 |
Core statistic. |
fast-path-dropped-filtering |
uint64 |
Number of packets dropped by fast path in IPv4 filtering (fp_dropped_netfilter). |
fast-path-dropped-filtering-cpu-id |
uint16 |
Core ID. |
fast-path-dropped-filtering-cpu-value |
uint64 |
Core statistic. |
fast-path-dropped-filtering-ipv6 |
uint64 |
Number of packets dropped by fast path in IPv6 filtering (fp_dropped_netfilter6). |
fast-path-dropped-filtering-ipv6-cpu-id |
uint16 |
Core ID. |
fast-path-dropped-filtering-ipv6-cpu-value |
uint64 |
Core statistic. |
fast-path-dropped-gre |
uint64 |
Number of packets dropped by fast path in GRE (fp_dropped_gre). |
fast-path-dropped-gre-cpu-id |
uint16 |
Core ID. |
fast-path-dropped-gre-cpu-value |
uint64 |
Core statistic. |
fast-path-dropped-gtp |
uint64 |
Number of packets dropped by fast path in GTP (fp_dropped_gtp). |
fast-path-dropped-gtp-cpu-id |
uint16 |
Core ID. |
fast-path-dropped-gtp-cpu-value |
uint64 |
Core statistic. |
fast-path-dropped-ip |
uint64 |
Number of packets dropped by fast path in generic IPv4 (fp_dropped_ip). |
fast-path-dropped-ip-cpu-id |
uint16 |
Core ID. |
fast-path-dropped-ip-cpu-value |
uint64 |
Core statistic. |
fast-path-dropped-ipsec |
uint64 |
Number of packets dropped by fast path in IPv4 IPsec (fp_dropped_ipsec). |
fast-path-dropped-ipsec-cpu-id |
uint16 |
Core ID. |
fast-path-dropped-ipsec-cpu-value |
uint64 |
Core statistic. |
fast-path-dropped-ipsec-ipv6 |
uint64 |
Number of packets dropped by fast path in IPv6 IPsec (fp_dropped_ipsec6). |
fast-path-dropped-ipsec-ipv6-cpu-id |
uint16 |
Core ID. |
fast-path-dropped-ipsec-ipv6-cpu-value |
uint64 |
Core statistic. |
fast-path-dropped-ipv6 |
uint64 |
Number of packets dropped by fast path in generic IPv6 (fp_dropped_ipv6). |
fast-path-dropped-ipv6-cpu-id |
uint16 |
Core ID. |
fast-path-dropped-ipv6-cpu-value |
uint64 |
Core statistic. |
fast-path-dropped-macvlan |
uint64 |
Number of packets dropped by fast path in MACVLAN (fp_dropped_macvlan). |
fast-path-dropped-macvlan-cpu-id |
uint16 |
Core ID. |
fast-path-dropped-macvlan-cpu-value |
uint64 |
Core statistic. |
fast-path-dropped-mpls |
uint64 |
Number of packets dropped by fast path in MultiProtocol Label Switching (fp_dropped_mpls). |
fast-path-dropped-mpls-cpu-id |
uint16 |
Core ID. |
fast-path-dropped-mpls-cpu-value |
uint64 |
Core statistic. |
fast-path-dropped-multicast |
uint64 |
Number of packets dropped by fast path in IPv4 multicast (fp_dropped_mcast). |
fast-path-dropped-multicast-cpu-id |
uint16 |
Core ID. |
fast-path-dropped-multicast-cpu-value |
uint64 |
Core statistic. |
fast-path-dropped-multicast-ipv6 |
uint64 |
Number of packets dropped by fast path in IPv6 multicast (fp_dropped_mcast6). |
fast-path-dropped-multicast-ipv6-cpu-id |
uint16 |
Core ID. |
fast-path-dropped-multicast-ipv6-cpu-value |
uint64 |
Core statistic. |
fast-path-dropped-npf |
uint64 |
Number of packets dropped by fast path in Network Address Translation and Carrier-grade NAT (fp_dropped_npf). |
fast-path-dropped-npf-cpu-id |
uint16 |
Core ID. |
fast-path-dropped-npf-cpu-value |
uint64 |
Core statistic. |
fast-path-dropped-ovs |
uint64 |
Number of packets dropped by fast path in Open vSwitch (fp_dropped_ovs). |
fast-path-dropped-ovs-cpu-id |
uint16 |
Core ID. |
fast-path-dropped-ovs-cpu-value |
uint64 |
Core statistic. |
fast-path-dropped-plugins |
uint64 |
Number of packets dropped by fast path in plugin (fp_dropped_plugins). |
fast-path-dropped-plugins-cpu-id |
uint16 |
Core ID. |
fast-path-dropped-plugins-cpu-value |
uint64 |
Core statistic. |
fast-path-dropped-qos |
uint64 |
Number of packets dropped by fast path in QoS (fp_dropped_qos). |
fast-path-dropped-qos-cpu-id |
uint16 |
Core ID. |
fast-path-dropped-qos-cpu-value |
uint64 |
Core statistic. |
fast-path-dropped-reassembly |
uint64 |
Number of packets dropped by fast path in IPv4 reassembly (fp_dropped_reasm). |
fast-path-dropped-reassembly-cpu-id |
uint16 |
Core ID. |
fast-path-dropped-reassembly-cpu-value |
uint64 |
Core statistic. |
fast-path-dropped-reassembly-ipv6 |
uint64 |
Number of packets dropped by fast path in IPv6 reassembly (fp_dropped_reasm6). |
fast-path-dropped-reassembly-ipv6-cpu-id |
uint16 |
Core ID. |
fast-path-dropped-reassembly-ipv6-cpu-value |
uint64 |
Core statistic. |
fast-path-dropped-system |
uint64 |
Number of packets dropped by fast path in internal processing (fp_dropped_system). |
fast-path-dropped-system-cpu-id |
uint16 |
Core ID. |
fast-path-dropped-system-cpu-value |
uint64 |
Core statistic. |
fast-path-dropped-tc |
uint64 |
Number of packets dropped by fast path in generic traffic conditioning (fp_dropped_tc). |
fast-path-dropped-tc-cpu-id |
uint16 |
Core ID. |
fast-path-dropped-tc-cpu-value |
uint64 |
Core statistic. |
fast-path-dropped-tc-erl |
uint64 |
Number of packets dropped by fast path in traffic conditioning by exception rate limitation (fp_dropped_tc_erl). |
fast-path-dropped-tc-erl-cpu-id |
uint16 |
Core ID. |
fast-path-dropped-tc-erl-cpu-value |
uint64 |
Core statistic. |
fast-path-dropped-tunnel |
uint64 |
Number of packets dropped by fast path in IPinIP tunnel (fp_dropped_tunnel). |
fast-path-dropped-tunnel-cpu-id |
uint16 |
Core ID. |
fast-path-dropped-tunnel-cpu-value |
uint64 |
Core statistic. |
fast-path-dropped-vethernet |
uint64 |
Number of packets dropped by fast path in vEthernet (fp_dropped_veth). |
fast-path-dropped-vethernet-cpu-id |
uint16 |
Core ID. |
fast-path-dropped-vethernet-cpu-value |
uint64 |
Core statistic. |
fast-path-dropped-vlan |
uint64 |
Number of packets dropped by fast path in VLAN (fp_dropped_vlan). |
fast-path-dropped-vlan-cpu-id |
uint16 |
Core ID. |
fast-path-dropped-vlan-cpu-value |
uint64 |
Core statistic. |
fast-path-dropped-vxlan |
uint64 |
Number of packets dropped by fast path in VXLAN (fp_dropped_vxlan). |
fast-path-dropped-vxlan-cpu-id |
uint16 |
Core ID. |
fast-path-dropped-vxlan-cpu-value |
uint64 |
Core statistic. |
fast-path-missing-ipsec-license |
uint64 |
Number of packets dropped in fast path due to missing ipsec license (fp_missing_ipsec_license). |
fast-path-missing-ipsec-license-cpu-id |
uint16 |
Core ID. |
fast-path-missing-ipsec-license-cpu-value |
uint64 |
Core statistic. |
fast-path-missing-product-license |
uint64 |
Number of packets dropped in fast path due to missing product license (fp_missing_product_license). |
fast-path-missing-product-license-cpu-id |
uint16 |
Core ID. |
fast-path-missing-product-license-cpu-value |
uint64 |
Core statistic. |
fp-gre-stats
The fast path GRE statistics.
Measure |
Type |
Description |
|---|---|---|
gre-dropped-init-gre-ipv4-header-failure |
uint64 |
Number of output packets dropped in GRE due to a failure to add the GRE header (GREDroppedInitGreIPv4HeaderFailure). |
gre-dropped-init-gre-ipv4-header-failure-cpu-id |
uint16 |
Core ID. |
gre-dropped-init-gre-ipv4-header-failure-cpu-value |
uint64 |
Core statistic. |
gre-dropped-init-gre-ipv6-header-failure |
uint64 |
Number of output packets dropped in GRE6 due to a failure to add the GRE header (GREDroppedInitGreIPv6HeaderFailure). |
gre-dropped-init-gre-ipv6-header-failure-cpu-id |
uint16 |
Core ID. |
gre-dropped-init-gre-ipv6-header-failure-cpu-value |
uint64 |
Core statistic. |
gre-dropped-init-ipv4-header-failure |
uint64 |
Number of output packets dropped in GRE due to a failure to add the IPv4 header (GREDroppedInitIPv4HeaderFailure). |
gre-dropped-init-ipv4-header-failure-cpu-id |
uint16 |
Core ID. |
gre-dropped-init-ipv4-header-failure-cpu-value |
uint64 |
Core statistic. |
gre-dropped-init-ipv6-header-failure |
uint64 |
Number of output packets dropped in GRE due to a failure to add the IPv4 header (GREDroppedInitIPv6HeaderFailure). |
gre-dropped-init-ipv6-header-failure-cpu-id |
uint16 |
Core ID. |
gre-dropped-init-ipv6-header-failure-cpu-value |
uint64 |
Core statistic. |
gre-dropped-in-operative |
uint64 |
Number of input packets dropped in GRE because the ingoing interface is down (GREDroppedInOperative). |
gre-dropped-in-operative-cpu-id |
uint16 |
Core ID. |
gre-dropped-in-operative-cpu-value |
uint64 |
Core statistic. |
gre-dropped-missing-checksum |
uint64 |
Number of input packets dropped in GRE due to a missing checksum (GREDroppedMissingChecksum). |
gre-dropped-missing-checksum-cpu-id |
uint16 |
Core ID. |
gre-dropped-missing-checksum-cpu-value |
uint64 |
Core statistic. |
gre-dropped-out-mtu-exceeded |
uint64 |
Number of output packets dropped in GRE due to packet size exceeding MTU (GREDroppedOutMtuExceeded). |
gre-dropped-out-mtu-exceeded-cpu-id |
uint16 |
Core ID. |
gre-dropped-out-mtu-exceeded-cpu-value |
uint64 |
Core statistic. |
gre-dropped-parse-ipv4-header-failure |
uint64 |
Number of input packets dropped in GRE due to failure to parse IPv4 header (GREDroppedParseIPv4HeaderFailure). |
gre-dropped-parse-ipv4-header-failure-cpu-id |
uint16 |
Core ID. |
gre-dropped-parse-ipv4-header-failure-cpu-value |
uint64 |
Core statistic. |
gre-dropped-parse-ipv6-header-failure |
uint64 |
Number of input packets dropped in GRE due to failure to parse IPv6 header (GREDroppedParseIPv6HeaderFailure). |
gre-dropped-parse-ipv6-header-failure-cpu-id |
uint16 |
Core ID. |
gre-dropped-parse-ipv6-header-failure-cpu-value |
uint64 |
Core statistic. |
gre-dropped-pullup-ipv4-header-failure |
uint64 |
Number of input packets dropped in IPv4 GRE due to pullup failure on gre header (GREDroppedPullupIPv4HeaderFailure). |
gre-dropped-pullup-ipv4-header-failure-cpu-id |
uint16 |
Core ID. |
gre-dropped-pullup-ipv4-header-failure-cpu-value |
uint64 |
Core statistic. |
gre-dropped-pullup-ipv6-header-failure |
uint64 |
Number of input packets dropped in IPv6 GRE due to pullup failure on gre header (GREDroppedPullupIPv6HeaderFailure). |
gre-dropped-pullup-ipv6-header-failure-cpu-id |
uint16 |
Core ID. |
gre-dropped-pullup-ipv6-header-failure-cpu-value |
uint64 |
Core statistic. |
gre-dropped-unexpected-checksum |
uint64 |
Number of input packets dropped in GRE due to an unexpected checksum (GREDroppedUnexpectedChecksum). |
gre-dropped-unexpected-checksum-cpu-id |
uint16 |
Core ID. |
gre-dropped-unexpected-checksum-cpu-value |
uint64 |
Core statistic. |
gre-dropped-wrong-checksum |
uint64 |
Number of input packets dropped in GRE due to an incorrect checksum (GREDroppedWrongChecksum). |
gre-dropped-wrong-checksum-cpu-id |
uint16 |
Core ID. |
gre-dropped-wrong-checksum-cpu-value |
uint64 |
Core statistic. |
gre-exception-input-unsupported-protocol |
uint64 |
Number of input packets sent to exception by GRE due to unsupported GRE protocol (GREExceptionInputUnsupportedProtocol). |
gre-exception-input-unsupported-protocol-cpu-id |
uint16 |
Core ID. |
gre-exception-input-unsupported-protocol-cpu-value |
uint64 |
Core statistic. |
gre-exception-ipv4-route |
uint64 |
Number of output packets sent to exception by GRE due to specific route (for IPv4 packet) (GREExceptionIPv4Route). |
gre-exception-ipv4-route-cpu-id |
uint16 |
Core ID. |
gre-exception-ipv4-route-cpu-value |
uint64 |
Core statistic. |
gre-exception-ipv4-source-select-failed |
uint64 |
Number of output packets sent to exception by GRE due to no src address can be set (for IPv4 packet) (GREExceptionIPv4SourceSelectFailed). |
gre-exception-ipv4-source-select-failed-cpu-id |
uint16 |
Core ID. |
gre-exception-ipv4-source-select-failed-cpu-value |
uint64 |
Core statistic. |
gre-exception-ipv6-route |
uint64 |
Number of output packets sent to exception by GRE due to specific route (for IPv6 packet) (GREExceptionIPv6Route). |
gre-exception-ipv6-route-cpu-id |
uint16 |
Core ID. |
gre-exception-ipv6-route-cpu-value |
uint64 |
Core statistic. |
gre-exception-output-unsupported-protocol |
uint64 |
Number of output packets sent to exception by GRE due to unsupported GRE protocol (GREExceptionOutputUnsupportedProtocol). |
gre-exception-output-unsupported-protocol-cpu-id |
uint16 |
Core ID. |
gre-exception-output-unsupported-protocol-cpu-value |
uint64 |
Core statistic. |
gre-exception-unknown-iface |
uint64 |
Number of output packets sent to exception by GRE due to an invalid GRE interface id (GREExceptionUnknownIface). |
gre-exception-unknown-iface-cpu-id |
uint16 |
Core ID. |
gre-exception-unknown-iface-cpu-value |
uint64 |
Core statistic. |
gre-exception-unsupported-ethernet-type |
uint64 |
Number of output packets sent to exception by GRE due to unsupported ethernet type (GREExceptionUnsupportedEtherType). |
gre-exception-unsupported-ethernet-type-cpu-id |
uint16 |
Core ID. |
gre-exception-unsupported-ethernet-type-cpu-value |
uint64 |
Core statistic. |
gre-invalid-header |
uint64 |
Number of input packets not managed by GRE due to routing flags set (see rfc 1701) or version number different to 0. The packet can be dropped or sent to exception later in other fast path processing part (GREInvalidHeader). |
gre-invalid-header-cpu-id |
uint16 |
Core ID. |
gre-invalid-header-cpu-value |
uint64 |
Core statistic. |
gre-protocol-not-supported |
uint64 |
Number of input packets not supported by GRE (GREProtocolNotSupported). |
gre-protocol-not-supported-cpu-id |
uint16 |
Core ID. |
gre-protocol-not-supported-cpu-value |
uint64 |
Core statistic. |
gretap-exception-unknown-iface |
uint64 |
Number of output packets sent to exception by GRETAP due to an invalid GRE interface id (GRETAPExceptionUnknownIface). |
gretap-exception-unknown-iface-cpu-id |
uint16 |
Core ID. |
gretap-exception-unknown-iface-cpu-value |
uint64 |
Core statistic. |
fp-gro-stats
The GRO module statistics per network interface.
Measure |
Type |
Description |
|---|---|---|
current-contexts |
uint64 |
The current number of GRO contexts in processing. |
flushed-contexts |
uint64 |
The number of GRO contexts flushed before timeout. |
timeout-contexts |
uint64 |
The number of GRO contexts flushed by timeout. |
done |
uint64 |
The number of packets merged by GRO module. |
in |
uint64 |
The number of packets entering GRO module. |
out |
uint64 |
The number of packets exiting GRO module. |
per-reassembly-mean |
uint64 |
The mean of packets per GRO reassembly. |
fp-ip-stats
The fast path IP statistics.
Measure |
Type |
Description |
|---|---|---|
ip-forwarded-datagrams |
uint64 |
Number of IP packets forwarded (IpForwDatagrams). |
ip-forwarded-datagrams-cpu-id |
uint16 |
Core ID. |
ip-forwarded-datagrams-cpu-value |
uint64 |
Core statistic. |
ip-in-delivered |
uint64 |
Number of IP packets delivered to user-protocols (IpInDelivers). |
ip-in-delivered-cpu-id |
uint16 |
Core ID. |
ip-in-delivered-cpu-value |
uint64 |
Core statistic. |
ip-in-received |
uint64 |
Number of IP packets received (IpInReceives). |
ip-in-received-cpu-id |
uint16 |
Core ID. |
ip-in-received-cpu-value |
uint64 |
Core statistic. |
ip-in-truncated-packets |
uint64 |
Number of IP packets discarded due to a truncate IP header (IpInTruncatedPkts). |
ip-in-truncated-packets-cpu-id |
uint16 |
Core ID. |
ip-in-truncated-packets-cpu-value |
uint64 |
Core statistic. |
ip-in-address-errors |
uint64 |
Number of IP packets discarded due to invalid IP address (IpInAddrErrors). |
ip-in-address-errors-cpu-id |
uint16 |
Core ID. |
ip-in-address-errors-cpu-value |
uint64 |
Core statistic. |
ip-in-header-errors |
uint64 |
Number of IP packets discarded due to errors in header (IpInHdrErrors). |
ip-in-header-errors-cpu-id |
uint16 |
Core ID. |
ip-in-header-errors-cpu-value |
uint64 |
Core statistic. |
ip-fragment-created |
uint64 |
Number of IP fragment packets created on fragmentation processing (IpFragCreates). |
ip-fragment-created-cpu-id |
uint16 |
Core ID. |
ip-fragment-created-cpu-value |
uint64 |
Core statistic. |
ip-fragment-ok |
uint64 |
Number of IP fragment packets sent successfully (IpFragOKs). |
ip-fragment-ok-cpu-id |
uint16 |
Core ID. |
ip-fragment-ok-cpu-value |
uint64 |
Core statistic. |
ip-fragment-failures |
uint64 |
Number of IP packets discarded due to failures during fragmentation processing (IpFragFails). |
ip-fragment-failures-cpu-id |
uint16 |
Core ID. |
ip-fragment-failures-cpu-value |
uint64 |
Core statistic. |
ip-reassembly-ok |
uint64 |
Number of IP packets successfully reassembled (IpReasmOKs). |
ip-reassembly-ok-cpu-id |
uint16 |
Core ID. |
ip-reassembly-ok-cpu-value |
uint64 |
Core statistic. |
ip-reassembly-required |
uint64 |
Number of IP fragments packets submitted to reassembly processing (IpReasmReqds). |
ip-reassembly-required-cpu-id |
uint16 |
Core ID. |
ip-reassembly-required-cpu-value |
uint64 |
Core statistic. |
ip-reassembly-exceptions |
uint64 |
Number of IP fragment packets sent in exception path (IpReasmExceptions). |
ip-reassembly-exceptions-cpu-id |
uint16 |
Core ID. |
ip-reassembly-exceptions-cpu-value |
uint64 |
Core statistic. |
ip-reassembly-failures |
uint64 |
Number of IP packets discarded due to failures during reassembly processing (IpReasmFails). |
ip-reassembly-failures-cpu-id |
uint16 |
Core ID. |
ip-reassembly-failures-cpu-value |
uint64 |
Core statistic. |
ip-reassembly-dropped-duplicate |
uint64 |
Number of IP packets dropped during reassembly considered as duplicate (IpReasmDroppedDuplicate). |
ip-reassembly-dropped-duplicate-cpu-id |
uint16 |
Core ID. |
ip-reassembly-dropped-duplicate-cpu-value |
uint64 |
Core statistic. |
ip-reassembly-dropped-session-complete |
uint64 |
Number of IP packets dropped during reassembly because the session is complete (IpReasmDroppedSessionComplete). |
ip-reassembly-dropped-session-complete-cpu-id |
uint16 |
Core ID. |
ip-reassembly-dropped-session-complete-cpu-value |
uint64 |
Core statistic. |
ip-reassembly-dropped-session-full |
uint64 |
Number of IP packets dropped during reassembly because the session is already full (IpReasmDroppedSessionAlreadyFull). |
ip-reassembly-dropped-session-full-cpu-id |
uint16 |
Core ID. |
ip-reassembly-dropped-session-full-cpu-value |
uint64 |
Core statistic. |
ip-reassembly-error-header-encapsulation |
uint64 |
Number of IP packets discarded during reassembly due to header encapsulation error (IpReasmErrorHeaderEncap). |
ip-reassembly-error-header-encapsulation-cpu-id |
uint16 |
Core ID. |
ip-reassembly-error-header-encapsulation-cpu-value |
uint64 |
Core statistic. |
ip-reassembly-error-ip-option-unsupported |
uint64 |
Number of IP packets discarded during reassembly due to unsupported IP option (IpReasmErrorIPOptionUnsupported). |
ip-reassembly-error-ip-option-unsupported-cpu-id |
uint16 |
Core ID. |
ip-reassembly-error-ip-option-unsupported-cpu-value |
uint64 |
Core statistic. |
ip-reassembly-error-last-already-received |
uint64 |
Number of IP packets discarded during reassembly due to receive twice the last fragment (IpReasmErrorLastAlreadyReceived). |
ip-reassembly-error-last-already-received-cpu-id |
uint16 |
Core ID. |
ip-reassembly-error-last-already-received-cpu-value |
uint64 |
Core statistic. |
ip-reassembly-error-offset-too-large |
uint64 |
Number of IP packets discarded during reassembly with offset due to an offset too big (IpReasmErrorOffsetTooLarge). |
ip-reassembly-error-offset-too-large-cpu-id |
uint16 |
Core ID. |
ip-reassembly-error-offset-too-large-cpu-value |
uint64 |
Core statistic. |
ip-reassembly-error-overlap-next |
uint64 |
Number of IP packets discarded during reassembly due to receive overlapping fragment with next one (IpReasmErrorOverlapNext). |
ip-reassembly-error-overlap-next-cpu-id |
uint16 |
Core ID. |
ip-reassembly-error-overlap-next-cpu-value |
uint64 |
Core statistic. |
ip-reassembly-error-overlap-previous |
uint64 |
Number of IP packets discarded during reassembly due to receive overlapping fragment with previous one (IpReasmErrorOverlapPrevious). |
ip-reassembly-error-overlap-previous-cpu-id |
uint16 |
Core ID. |
ip-reassembly-error-overlap-previous-cpu-value |
uint64 |
Core statistic. |
ip-reassembly-error-packet-too-short |
uint64 |
Number of IP packets discarded during reassembly due to reception of a too short fragment (IpReasmErrorPacketTooShort). |
ip-reassembly-error-packet-too-short-cpu-id |
uint16 |
Core ID. |
ip-reassembly-error-packet-too-short-cpu-value |
uint64 |
Core statistic. |
ip-reassembly-error-queue-allocation |
uint64 |
Number of IP packets discarded during reassembly due to reassembly queue allocation failure (IpReasmErrorQueueAlloc). |
ip-reassembly-error-queue-allocation-cpu-id |
uint16 |
Core ID. |
ip-reassembly-error-queue-allocation-cpu-value |
uint64 |
Core statistic. |
ip-reassembly-error-queue-full |
uint64 |
Number of IP packets discarded during reassembly due to reassembly queue full (too many fragments have been received) (IpReasmErrorQueueFull). |
ip-reassembly-error-queue-full-cpu-id |
uint16 |
Core ID. |
ip-reassembly-error-queue-full-cpu-value |
uint64 |
Core statistic. |
ip-reassembly-error-size-exceed |
uint64 |
Number of IP packets discarded during reassembly due to total received bytes greater than the maximal authorized value (65535) (IpReasmErrorSizeExceed). |
ip-reassembly-error-size-exceed-cpu-id |
uint16 |
Core ID. |
ip-reassembly-error-size-exceed-cpu-value |
uint64 |
Core statistic. |
ip-reassembly-error-size-overflow |
uint64 |
Number of IP packets discarded during reassembly due to total received bytes greater than the expected value (IpReasmErrorSizeOverflow). |
ip-reassembly-error-size-overflow-cpu-id |
uint16 |
Core ID. |
ip-reassembly-error-size-overflow-cpu-value |
uint64 |
Core statistic. |
ip-reassembly-error-too-many-segments |
uint64 |
Number of IP packets discarded during reassembly due to too many segments in IP packets (IpReasmErrorTooManySegments). |
ip-reassembly-error-too-many-segments-cpu-id |
uint16 |
Core ID. |
ip-reassembly-error-too-many-segments-cpu-value |
uint64 |
Core statistic. |
ip-reassembly-timeout |
uint64 |
Number of IP packets discarded due to timeout in reassembly processing (IpReasmTimeout). |
ip-reassembly-timeout-cpu-id |
uint16 |
Core ID. |
ip-reassembly-timeout-cpu-value |
uint64 |
Core statistic. |
ip-checksum-errors |
uint64 |
Number of IP packets discarded due to an invalid checksum (IpCsumErrors). |
ip-checksum-errors-cpu-id |
uint16 |
Core ID. |
ip-checksum-errors-cpu-value |
uint64 |
Core statistic. |
ip-dropped-blackhole |
uint64 |
Number of IP packets discarded due to matching blackhole route (IpDroppedBlackhole). |
ip-dropped-blackhole-cpu-id |
uint16 |
Core ID. |
ip-dropped-blackhole-cpu-value |
uint64 |
Core statistic. |
ip-dropped-filtering |
uint64 |
Number of IP packets discarded by filtering processing (IpDroppedNetfilter). |
ip-dropped-filtering-cpu-id |
uint16 |
Core ID. |
ip-dropped-filtering-cpu-value |
uint64 |
Core statistic. |
ip-dropped-forwarding |
uint64 |
Number of IP packets discarded due to forwarding being disabled (IpDroppedForwarding). |
ip-dropped-forwarding-cpu-id |
uint16 |
Core ID. |
ip-dropped-forwarding-cpu-value |
uint64 |
Core statistic. |
ip-dropped-invalid-interface |
uint64 |
Number of IP packets discarded due to invalid outgoing interface (IpDroppedInvalidInterface). |
ip-dropped-invalid-interface-cpu-id |
uint16 |
Core ID. |
ip-dropped-invalid-interface-cpu-value |
uint64 |
Core statistic. |
ip-dropped-ipsec |
uint64 |
Number of IP packets discarded by IPsec processing (IpDroppedIPsec). |
ip-dropped-ipsec-cpu-id |
uint16 |
Core ID. |
ip-dropped-ipsec-cpu-value |
uint64 |
Core statistic. |
ip-dropped-mtu-exceeded |
uint64 |
Number of IP packets discarded due to exceeding MTU (IpDroppedMtuExceeded). |
ip-dropped-mtu-exceeded-cpu-id |
uint16 |
Core ID. |
ip-dropped-mtu-exceeded-cpu-value |
uint64 |
Core statistic. |
ip-dropped-no-arp |
uint64 |
Number of IP packets discarded due to missing ARP resolution (IpDroppedNoArp). |
ip-dropped-no-arp-cpu-id |
uint16 |
Core ID. |
ip-dropped-no-arp-cpu-value |
uint64 |
Core statistic. |
ip-dropped-no-memory |
uint64 |
Number of IP packets discarded due to memory allocation errors (IpDroppedNoMemory). |
ip-dropped-no-memory-cpu-id |
uint16 |
Core ID. |
ip-dropped-no-memory-cpu-value |
uint64 |
Core statistic. |
ip-dropped-out-operative |
uint64 |
Number of IP packets discarded because the outgoing interface is down (IPDroppedOutOperative). |
ip-dropped-out-operative-cpu-id |
uint16 |
Core ID. |
ip-dropped-out-operative-cpu-value |
uint64 |
Core statistic. |
ip-dropped-route-exception |
uint64 |
Number of IP packets sent to exception due to specific route (IpDroppedRouteException). |
ip-dropped-route-exception-cpu-id |
uint16 |
Core ID. |
ip-dropped-route-exception-cpu-value |
uint64 |
Core statistic. |
ip-nhrp-packet |
uint64 |
Number of IP NHRP packets (IpNhrpPacket). |
ip-nhrp-packet-cpu-id |
uint16 |
Core ID. |
ip-nhrp-packet-cpu-value |
uint64 |
Core statistic. |
ip-nhrp-error-send |
uint64 |
Number of discarded sent IP NHRP packets (IpNhrpErrorSend). |
ip-nhrp-error-send-cpu-id |
uint16 |
Core ID. |
ip-nhrp-error-send-cpu-value |
uint64 |
Core statistic. |
ip-segment-routing-ipv6-encapsulation |
uint64 |
Number of SRv6 encapsulated packets (IpSr6Encap). |
ip-segment-routing-ipv6-encapsulation-cpu-id |
uint16 |
Core ID. |
ip-segment-routing-ipv6-encapsulation-cpu-value |
uint64 |
Core statistic. |
fp-ip6-stats
The fast path IPv6 statistics.
Measure |
Type |
Description |
|---|---|---|
ip6-forwarded-datagrams |
uint64 |
Number of IPv6 packets forwarded (IpForwDatagrams). |
ip6-forwarded-datagrams-cpu-id |
uint16 |
Core ID. |
ip6-forwarded-datagrams-cpu-value |
uint64 |
Core statistic. |
ip6-in-delivered |
uint64 |
Number of IPv6 packets delivered to user-protocols (IpInDelivers). |
ip6-in-delivered-cpu-id |
uint16 |
Core ID. |
ip6-in-delivered-cpu-value |
uint64 |
Core statistic. |
ip6-in-received |
uint64 |
Number of IPv6 packets received (IpInReceives). |
ip6-in-received-cpu-id |
uint16 |
Core ID. |
ip6-in-received-cpu-value |
uint64 |
Core statistic. |
ip6-in-truncated-packets |
uint64 |
Number of IPv6 packets discarded due to a truncate IP header (IpInTruncatedPkts). |
ip6-in-truncated-packets-cpu-id |
uint16 |
Core ID. |
ip6-in-truncated-packets-cpu-value |
uint64 |
Core statistic. |
ip6-in-address-errors |
uint64 |
Number of IPv6 packets discarded due to invalid IPv6 address (IpInAddrErrors). |
ip6-in-address-errors-cpu-id |
uint16 |
Core ID. |
ip6-in-address-errors-cpu-value |
uint64 |
Core statistic. |
ip6-in-header-errors |
uint64 |
Number of IPv6 packets discarded due to errors in header (IpInHdrErrors). |
ip6-in-header-errors-cpu-id |
uint16 |
Core ID. |
ip6-in-header-errors-cpu-value |
uint64 |
Core statistic. |
ip6-fragment-created |
uint64 |
Number of IPv6 fragment packets created on fragmentation processing (IpFragCreates). |
ip6-fragment-created-cpu-id |
uint16 |
Core ID. |
ip6-fragment-created-cpu-value |
uint64 |
Core statistic. |
ip6-fragment-ok |
uint64 |
Number of IPv6 fragment packets sent successfully (IpFragOKs). |
ip6-fragment-ok-cpu-id |
uint16 |
Core ID. |
ip6-fragment-ok-cpu-value |
uint64 |
Core statistic. |
ip6-fragment-failures |
uint64 |
Number of IPv6 packets discarded due to failures during fragmentation processing (IpFragFails). |
ip6-fragment-failures-cpu-id |
uint16 |
Core ID. |
ip6-fragment-failures-cpu-value |
uint64 |
Core statistic. |
ip6-fragment-reassembly-exceptions |
uint64 |
Number of IP fragment packets sent in exception path. |
ip6-fragment-reassembly-exceptions-cpu-id |
uint16 |
Core ID. |
ip6-fragment-reassembly-exceptions-cpu-value |
uint64 |
Core statistic. |
ip6-reassembly-ok |
uint64 |
Number of IPv6 packets successfully reassembled (IpReasmOKs). |
ip6-reassembly-ok-cpu-id |
uint16 |
Core ID. |
ip6-reassembly-ok-cpu-value |
uint64 |
Core statistic. |
ip6-reassembly-required |
uint64 |
Number of IPv6 fragments packets submitted to reassembly processing (IpReasmReqds). |
ip6-reassembly-required-cpu-id |
uint16 |
Core ID. |
ip6-reassembly-required-cpu-value |
uint64 |
Core statistic. |
ip6-reassembly-exceptions |
uint64 |
Number of IPv6 fragment packets sent in exception path (IpReasmExceptions). |
ip6-reassembly-exceptions-cpu-id |
uint16 |
Core ID. |
ip6-reassembly-exceptions-cpu-value |
uint64 |
Core statistic. |
ip6-reassembly-failures |
uint64 |
Number of IPv6 packets discarded due to failures during reassembly processing (IpReasmFails). |
ip6-reassembly-failures-cpu-id |
uint16 |
Core ID. |
ip6-reassembly-failures-cpu-value |
uint64 |
Core statistic. |
ip6-reassembly-dropped-session-complete |
uint64 |
Number of IPv6 packets dropped during reassembly because the session is complete (IpReasmDroppedSessionComplete). |
ip6-reassembly-dropped-session-complete-cpu-id |
uint16 |
Core ID. |
ip6-reassembly-dropped-session-complete-cpu-value |
uint64 |
Core statistic. |
ip6-reassembly-dropped-session-full |
uint64 |
Number of IPv6 packets dropped during reassembly because the session is already full (IpReasmDroppedSessionAlreadyFull). |
ip6-reassembly-dropped-session-full-cpu-id |
uint16 |
Core ID. |
ip6-reassembly-dropped-session-full-cpu-value |
uint64 |
Core statistic. |
ip6-reassembly-error-fragment-header |
uint64 |
Number of IPv6 packets discarded during reassembly due to header reading error (IpReasmErrorFragmentHeader). |
ip6-reassembly-error-fragment-header-cpu-id |
uint16 |
Core ID. |
ip6-reassembly-error-fragment-header-cpu-value |
uint64 |
Core statistic. |
ip6-reassembly-error-header-encapsulation |
uint64 |
Number of IPv6 packets discarded during reassembly due to header encapsulation error (IpReasmErrorHeaderEncap). |
ip6-reassembly-error-header-encapsulation-cpu-id |
uint16 |
Core ID. |
ip6-reassembly-error-header-encapsulation-cpu-value |
uint64 |
Core statistic. |
ip6-reassembly-error-ip6-option-too-large |
uint64 |
Number of IPv6 packets discarded during reassembly due to IPv6 option too large (IpReasmErrorIPOptionTooLarge). |
ip6-reassembly-error-ip6-option-too-large-cpu-id |
uint16 |
Core ID. |
ip6-reassembly-error-ip6-option-too-large-cpu-value |
uint64 |
Core statistic. |
ip6-reassembly-error-last-already-received |
uint64 |
Number of IPv6 packets discarded during reassembly due to receive twice the last fragment (IpReasmErrorLastAlreadyReceived). |
ip6-reassembly-error-last-already-received-cpu-id |
uint16 |
Core ID. |
ip6-reassembly-error-last-already-received-cpu-value |
uint64 |
Core statistic. |
ip6-reassembly-error-offset-too-large |
uint64 |
Number of IPv6 packets discarded during reassembly with offset due to an offset too big (IpReasmErrorOffsetTooLarge). |
ip6-reassembly-error-offset-too-large-cpu-id |
uint16 |
Core ID. |
ip6-reassembly-error-offset-too-large-cpu-value |
uint64 |
Core statistic. |
ip6-reassembly-error-overlap-next |
uint64 |
Number of IPv6 packets discarded during reassembly due to receive overlapping fragment with next one (IpReasmErrorOverlapNext). |
ip6-reassembly-error-overlap-next-cpu-id |
uint16 |
Core ID. |
ip6-reassembly-error-overlap-next-cpu-value |
uint64 |
Core statistic. |
ip6-reassembly-error-overlap-previous |
uint64 |
Number of IPv6 packets discarded during reassembly due to receive overlapping fragment with previous one (IpReasmErrorOverlapPrevious). |
ip6-reassembly-error-overlap-previous-cpu-id |
uint16 |
Core ID. |
ip6-reassembly-error-overlap-previous-cpu-value |
uint64 |
Core statistic. |
ip6-reassembly-error-packet-too-short |
uint64 |
Number of IPv6 packets discarded during reassembly due to reception of a too short fragment (IpReasmErrorPacketTooShort). |
ip6-reassembly-error-packet-too-short-cpu-id |
uint16 |
Core ID. |
ip6-reassembly-error-packet-too-short-cpu-value |
uint64 |
Core statistic. |
ip6-reassembly-error-queue-allocation |
uint64 |
Number of IPv6 packets discarded during reassembly due to reassembly queue allocation failure (IpReasmErrorQueueAlloc). |
ip6-reassembly-error-queue-allocation-cpu-id |
uint16 |
Core ID. |
ip6-reassembly-error-queue-allocation-cpu-value |
uint64 |
Core statistic. |
ip6-reassembly-error-queue-full |
uint64 |
Number of IPv6 packets discarded during reassembly due to reassembly queue full (too many fragments have been received) (IpReasmErrorQueueFull). |
ip6-reassembly-error-queue-full-cpu-id |
uint16 |
Core ID. |
ip6-reassembly-error-queue-full-cpu-value |
uint64 |
Core statistic. |
ip6-reassembly-error-size-exceed |
uint64 |
Number of IPv6 packets discarded during reassembly due to total received bytes greater than the maximal authorized value (65535) (IpReasmErrorSizeExceed). |
ip6-reassembly-error-size-exceed-cpu-id |
uint16 |
Core ID. |
ip6-reassembly-error-size-exceed-cpu-value |
uint64 |
Core statistic. |
ip6-reassembly-error-size-overflow |
uint64 |
Number of IPv6 packets discarded during reassembly due to total received bytes greater than the expected value (IpReasmErrorSizeOverflow). |
ip6-reassembly-error-size-overflow-cpu-id |
uint16 |
Core ID. |
ip6-reassembly-error-size-overflow-cpu-value |
uint64 |
Core statistic. |
ip6-reassembly-error-too-many-segments |
uint64 |
Number of IPv6 packets discarded during reassembly due to too many segments in IP packets (IpReasmErrorTooManySegments). |
ip6-reassembly-error-too-many-segments-cpu-id |
uint16 |
Core ID. |
ip6-reassembly-error-too-many-segments-cpu-value |
uint64 |
Core statistic. |
ip6-reassembly-timeout |
uint64 |
Number of IPv6 packets discarded due to timeout in reassembly processing (IpReasmTimeout). |
ip6-reassembly-timeout-cpu-id |
uint16 |
Core ID. |
ip6-reassembly-timeout-cpu-value |
uint64 |
Core statistic. |
ip6-dropped-blackhole |
uint64 |
Number of IPv6 packets discarded due to matching blackhole route (IpDroppedBlackhole). |
ip6-dropped-blackhole-cpu-id |
uint16 |
Core ID. |
ip6-dropped-blackhole-cpu-value |
uint64 |
Core statistic. |
ip6-dropped-filtering |
uint64 |
Number of IPv6 packets discarded by filtering processing (IpDroppedNetfilter). |
ip6-dropped-filtering-cpu-id |
uint16 |
Core ID. |
ip6-dropped-filtering-cpu-value |
uint64 |
Core statistic. |
ip6-dropped-forwarding |
uint64 |
Number of IPv6 packets discarded due to forwarding being disabled (IpDroppedForwarding). |
ip6-dropped-forwarding-cpu-id |
uint16 |
Core ID. |
ip6-dropped-forwarding-cpu-value |
uint64 |
Core statistic. |
ip6-dropped-invalid-interface |
uint64 |
Number of IPv6 packets discarded due to invalid outgoing interface (IpDroppedInvalidInterface). |
ip6-dropped-invalid-interface-cpu-id |
uint16 |
Core ID. |
ip6-dropped-invalid-interface-cpu-value |
uint64 |
Core statistic. |
ip6-dropped-ipsec |
uint64 |
Number of IPv6 packets discarded by IPsec processing (IpDroppedIPsec). |
ip6-dropped-ipsec-cpu-id |
uint16 |
Core ID. |
ip6-dropped-ipsec-cpu-value |
uint64 |
Core statistic. |
ip6-dropped-mtu-exceeded |
uint64 |
Number of IPv6 packets discarded due to exceeding MTU (IpDroppedMtuExceeded). |
ip6-dropped-mtu-exceeded-cpu-id |
uint16 |
Core ID. |
ip6-dropped-mtu-exceeded-cpu-value |
uint64 |
Core statistic. |
ip6-dropped-no-arp |
uint64 |
Number of IPv6 packets discarded due to missing ARP resolution (IpDroppedNoArp). |
ip6-dropped-no-arp-cpu-id |
uint16 |
Core ID. |
ip6-dropped-no-arp-cpu-value |
uint64 |
Core statistic. |
ip6-dropped-no-memory |
uint64 |
Number of IPv6 packets discarded due to memory allocation errors (IpDroppedNoMemory). |
ip6-dropped-no-memory-cpu-id |
uint16 |
Core ID. |
ip6-dropped-no-memory-cpu-value |
uint64 |
Core statistic. |
ip6-dropped-out-operative |
uint64 |
Number of IPv6 packets discarded because the outgoing interface is down (IPDroppedOutOperative). |
ip6-dropped-out-operative-cpu-id |
uint16 |
Core ID. |
ip6-dropped-out-operative-cpu-value |
uint64 |
Core statistic. |
ip6-dropped-route-exception |
uint64 |
Number of IPv6 packets sent to exception due to specific route (IpDroppedRouteException). |
ip6-dropped-route-exception-cpu-id |
uint16 |
Core ID. |
ip6-dropped-route-exception-cpu-value |
uint64 |
Core statistic. |
ip6-nhrp-packet |
uint64 |
Number of IPv6 NHRP packets (IpNhrpPacket). |
ip6-nhrp-packet-cpu-id |
uint16 |
Core ID. |
ip6-nhrp-packet-cpu-value |
uint64 |
Core statistic. |
ip6-nhrp-error-send |
uint64 |
Number of discarded sent IPv6 NHRP packets (IpNhrpErrorSend). |
ip6-nhrp-error-send-cpu-id |
uint16 |
Core ID. |
ip6-nhrp-error-send-cpu-value |
uint64 |
Core statistic. |
ip6-segment-routing-ipv6-header-processed |
uint64 |
Number of SRv6 headers processed (IpSr6HdrProcessed). |
ip6-segment-routing-ipv6-header-processed-cpu-id |
uint16 |
Core ID. |
ip6-segment-routing-ipv6-header-processed-cpu-value |
uint64 |
Core statistic. |
fp-ipsec-stats
The fast path IPsec statistics (requires IPsec license).
Measure |
Type |
Description |
|---|---|---|
ipsec-ipv4-in-sa |
uint64 |
Number of IPv4 packets decrypted with a security association (IpsecInSA). |
ipsec-ipv4-in-sa-cpu-id |
uint16 |
Core ID. |
ipsec-ipv4-in-sa-cpu-value |
uint64 |
Core statistic. |
ipsec-ipv4-out-sa |
uint64 |
Number of IPv4 packets encrypted with a security association (IpsecOutSA). |
ipsec-ipv4-out-sa-cpu-id |
uint16 |
Core ID. |
ipsec-ipv4-out-sa-cpu-value |
uint64 |
Core statistic. |
fp-ipsec6-stats
The fast path IPv6 statistics (requires IPsec license).
Measure |
Type |
Description |
|---|---|---|
ipsec-ipv6-in-sa |
uint64 |
Number of IPv6 packets decrypted with a security association (Ipsec6InSA). |
ipsec-ipv6-in-sa-cpu-id |
uint16 |
Core ID. |
ipsec-ipv6-in-sa-cpu-value |
uint64 |
Core statistic. |
ipsec-ipv6-out-sa |
uint64 |
Number of IPv6 packets encrypted with a security association (Ipsec6OutSA). |
ipsec-ipv6-out-sa-cpu-id |
uint16 |
Core ID. |
ipsec-ipv6-out-sa-cpu-value |
uint64 |
Core statistic. |
fp-ports-stats
The list of fast path statistics per port.
Measure |
Type |
Description |
|---|---|---|
vrf |
string |
The interface VRF. |
name |
string |
The interface name. |
interface-cp-protection-rx-control-plane-kept |
uint64 |
When the Rx ring filling reaches a threshold, packets are inspected by the Control Plane Protection mechanism. This statistic is incremented for packets recognized as CP packets, which are kept and processed by the stack. |
interface-cp-protection-rx-control-plane-overrun |
uint64 |
When CPU consumption used by Control Plane Protection exceeds a threshold, this system is disabled. This statistic is incremented for each Rx packet not analyzed by Control Plane Protection due to CPU overload. |
interface-cp-protection-rx-control-plane-passthrough |
uint64 |
When Control Plane Protection is enabled, this statistic is incremented for each packet received when machine is not overloaded. These packets are processed normally. |
interface-cp-protection-rx-data-plane-drop |
uint64 |
When the Rx ring filling reaches a threshold, packets are inspected by the Control Plane Protection mechanism. This statistic is incremented for packets recognized as DP packets, which are dropped. |
interface-cp-protection-tx-control-plane-kept |
uint64 |
When the Tx ring filling reaches a threshold, packets are inspected by the Control Plane Protection mechanism. This statistic is incremented for packets recognized as CP packets, which are sent on the wire. |
interface-cp-protection-tx-control-plane-overrun |
uint64 |
When CPU consumption used by Control Plane Protection exceeds a threshold, this system is disabled. This statistic is incremented for each Tx packet not analyzed by Control Plane Protection due to CPU overload. |
interface-cp-protection-tx-control-plane-passthrough |
uint64 |
When Control Plane Protection is enabled, this statistic is incremented for each packet transmitted on a link that is not overloaded. These packets are sent normally. |
interface-cp-protection-tx-data-plane-drop |
uint64 |
When the Tx ring filling reaches a threshold, packets are inspected by the Control Plane Protection mechanism. This statistic is incremented for packets recognized as DP packets, which are dropped. |
interface-gro-current-contexts |
uint64 |
The current number of GRO contexts in processing. |
interface-gro-flushed-contexts |
uint64 |
The number of GRO contexts flushed before timeout. |
interface-gro-timeout-contexts |
uint64 |
The number of GRO contexts flushed by timeout. |
interface-gro-done |
uint64 |
The number of packets merged by GRO module. |
interface-gro-in |
uint64 |
The number of packets entering GRO module. |
interface-gro-out |
uint64 |
The number of packets exiting GRO module. |
interface-gro-per-reassembly-mean |
uint64 |
The mean of packets per GRO reassembly. |
* |
uint64 |
The driver vendor specific NIC statistics (rx_*, tx_*, etc). |
fp-status
The fast path status.
Measure |
Type |
Description |
|---|---|---|
value |
uint8 |
The Fast Path status in number. 0 - ok, 1 - loaded, 2 - stopped, 3 - bad. |
fp-vlan-stats
The fast path VLAN statistics.
Measure |
Type |
Description |
|---|---|---|
vlan-dropped-in-operative |
uint64 |
Number of input packets dropped in VLAN because the incoming interface is down (VlanDroppedInOperative). |
vlan-dropped-in-operative-cpu-id |
uint16 |
Core ID. |
vlan-dropped-in-operative-cpu-value |
uint64 |
Core statistic. |
vlan-dropped-input-unknown-interface |
uint64 |
Number of input packets dropped in VLAN due to unknown interface (VlanDroppedInputUnknownIf). |
vlan-dropped-input-unknown-interface-cpu-id |
uint16 |
Core ID. |
vlan-dropped-input-unknown-interface-cpu-value |
uint64 |
Core statistic. |
vlan-dropped-invalid-tag |
uint64 |
Number of input packets dropped in VLAN due to an invalid tag (VlanDroppedInvalidTag). |
vlan-dropped-invalid-tag-cpu-id |
uint16 |
Core ID. |
vlan-dropped-invalid-tag-cpu-value |
uint64 |
Core statistic. |
vlan-dropped-prepend-failure |
uint64 |
Number of output packets dropped in VLAN due to a failure to add VLAN tag (VlanDroppedPrependFailure). |
vlan-dropped-prepend-failure-cpu-id |
uint16 |
Core ID. |
vlan-dropped-prepend-failure-cpu-value |
uint64 |
Core statistic. |
vlan-output-unknown-interface |
uint64 |
Number of output packets with unknown interface (VlanOutputUnknownIf). |
vlan-output-unknown-interface-cpu-id |
uint16 |
Core ID. |
vlan-output-unknown-interface-cpu-value |
uint64 |
Core statistic. |
vlan-unknown-tag |
uint64 |
Number of packets with unknown VLAN tag (VlanUnknownTag). |
vlan-unknown-tag-cpu-id |
uint16 |
Core ID. |
vlan-unknown-tag-cpu-value |
uint64 |
Core statistic. |
fp-vxlan-stats
The fast path VXLAN statistics.
Measure |
Type |
Description |
|---|---|---|
vxlan-dropped-header-too-short |
uint64 |
Number of input packets dropped in VXLAN due to a VXLAN header too short (VxlanDroppedHeaderTooShort). |
vxlan-dropped-header-too-short-cpu-id |
uint16 |
Core ID. |
vxlan-dropped-header-too-short-cpu-value |
uint64 |
Core statistic. |
vxlan-dropped-in-operative |
uint64 |
Number of input packets dropped in VXLAN because the incoming interface is down (VxlanDroppedInOperative). |
vxlan-dropped-in-operative-cpu-id |
uint16 |
Core ID. |
vxlan-dropped-in-operative-cpu-value |
uint64 |
Core statistic. |
vxlan-dropped-invalid-ip-family |
uint64 |
Number of output packets dropped in VXLAN due to a failure to get the VXLAN header (VxlanDroppedInvalidIpFamily). |
vxlan-dropped-invalid-ip-family-cpu-id |
uint16 |
Core ID. |
vxlan-dropped-invalid-ip-family-cpu-value |
uint64 |
Core statistic. |
vxlan-dropped-invalid-ipv4-checksum |
uint64 |
Number of input packets dropped in IPv4 VXLAN due to an invalid checksum (VxlanDroppedInvalidIPv4Csum). |
vxlan-dropped-invalid-ipv4-checksum-cpu-id |
uint16 |
Core ID. |
vxlan-dropped-invalid-ipv4-checksum-cpu-value |
uint64 |
Core statistic. |
vxlan-dropped-invalid-ipv4-header |
uint64 |
Number of input packets dropped in IPv4 VXLAN due to a failure to get the VXLAN header (VxlanDroppedInvalidIPv4Header). |
vxlan-dropped-invalid-ipv4-header-cpu-id |
uint16 |
Core ID. |
vxlan-dropped-invalid-ipv4-header-cpu-value |
uint64 |
Core statistic. |
vxlan-dropped-invalid-ipv6-checksum |
uint64 |
Number of input packets dropped in IPv4 VXLAN due to an invalid checksum (VxlanDroppedInvalidIPv6Csum). |
vxlan-dropped-invalid-ipv6-checksum-cpu-id |
uint16 |
Core ID. |
vxlan-dropped-invalid-ipv6-checksum-cpu-value |
uint64 |
Core statistic. |
vxlan-dropped-invalid-ipv6-header |
uint64 |
Number of input packets dropped in IPv6 VXLAN due to a failure to get the VXLAN header (VxlanDroppedInvalidIPv6Header). |
vxlan-dropped-invalid-ipv6-header-cpu-id |
uint16 |
Core ID. |
vxlan-dropped-invalid-ipv6-header-cpu-value |
uint64 |
Core statistic. |
vxlan-dropped-ipv4-mtu-exceeded |
uint64 |
Number of output packets dropped in IPv4 VXLAN due to a MTU exceeded the authorized value (VxlanDroppedIPv4MtuExceeded). |
vxlan-dropped-ipv4-mtu-exceeded-cpu-id |
uint16 |
Core ID. |
vxlan-dropped-ipv4-mtu-exceeded-cpu-value |
uint64 |
Core statistic. |
vxlan-dropped-ipv4-no-destination |
uint64 |
Number of output packets dropped in IPv4 VXLAN due to a null destination address (VxlanDroppedIPv4NoDst). |
vxlan-dropped-ipv4-no-destination-cpu-id |
uint16 |
Core ID. |
vxlan-dropped-ipv4-no-destination-cpu-value |
uint64 |
Core statistic. |
vxlan-dropped-ipv6-mtu-exceeded |
uint64 |
Number of output packets dropped in IPv6 VXLAN due to a MTU exceeded the authorized value (VxlanDroppedIPv6MtuExceeded). |
vxlan-dropped-ipv6-mtu-exceeded-cpu-id |
uint16 |
Core ID. |
vxlan-dropped-ipv6-mtu-exceeded-cpu-value |
uint64 |
Core statistic. |
vxlan-dropped-ipv6-no-destination |
uint64 |
Number of output packets dropped in IPv6 VXLAN due to a null destination address (VxlanDroppedIPv6NoDst). |
vxlan-dropped-ipv6-no-destination-cpu-id |
uint16 |
Core ID. |
vxlan-dropped-ipv6-no-destination-cpu-value |
uint64 |
Core statistic. |
vxlan-dropped-ovs-mtu-exceeded |
uint64 |
Number of output packets dropped in OVS VXLAN due to a MTU exceeded the authorized value (VxlanDroppedOvsMtuExceeded). |
vxlan-dropped-ovs-mtu-exceeded-cpu-id |
uint16 |
Core ID. |
vxlan-dropped-ovs-mtu-exceeded-cpu-value |
uint64 |
Core statistic. |
vxlan-dropped-ovs-no-destination |
uint64 |
Number of output packets dropped in OVS VXLAN due to a null destination address (VxlanDroppedOvsNoDst). |
vxlan-dropped-ovs-no-destination-cpu-id |
uint16 |
Core ID. |
vxlan-dropped-ovs-no-destination-cpu-value |
uint64 |
Core statistic. |
vxlan-dropped-prepend-ipv4-failure |
uint64 |
Number of output packets dropped in IPv4 VXLAN due to add IP header (VxlanDroppedPrependIPv4Failure). |
vxlan-dropped-prepend-ipv4-failure-cpu-id |
uint16 |
Core ID. |
vxlan-dropped-prepend-ipv4-failure-cpu-value |
uint64 |
Core statistic. |
vxlan-dropped-prepend-ipv6-failure |
uint64 |
Number of output packets dropped in IPv6 VXLAN due to add IP header (VxlanDroppedPrependIPv6Failure). |
vxlan-dropped-prepend-ipv6-failure-cpu-id |
uint16 |
Core ID. |
vxlan-dropped-prepend-ipv6-failure-cpu-value |
uint64 |
Core statistic. |
vxlan-dropped-prepend-ovs-failure |
uint64 |
Number of output packets dropped in OVS VXLAN due to add IP header (VxlanDroppedPrependOvsFailure). |
vxlan-dropped-prepend-ovs-failure-cpu-id |
uint16 |
Core ID. |
vxlan-dropped-prepend-ovs-failure-cpu-value |
uint64 |
Core statistic. |
vxlan-dropped-unknown-iface |
uint64 |
Number of input packets dropped in VXLAN due to an invalid interface (VxlanDroppedUnknownIface). |
vxlan-dropped-unknown-iface-cpu-id |
uint16 |
Core ID. |
vxlan-dropped-unknown-iface-cpu-value |
uint64 |
Core statistic. |
vxlan-dropped-unknown-vni |
uint64 |
Number of input packets dropped in VXLAN due to an invalid VNI (VxlanDroppedUnknownVNI). |
vxlan-dropped-unknown-vni-cpu-id |
uint16 |
Core ID. |
vxlan-dropped-unknown-vni-cpu-value |
uint64 |
Core statistic. |
vxlan-exception-i-flag-not-set |
uint64 |
Number of input packets sent to exception by VXLAN due a I flags not set (see rfc 7348) (VxlanExceptionIFlagNotSet). |
vxlan-exception-i-flag-not-set-cpu-id |
uint16 |
Core ID. |
vxlan-exception-i-flag-not-set-cpu-value |
uint64 |
Core statistic. |
vxlan-exception-ipv4-no-multicast-source |
uint64 |
Number of output packets sent to exception by IPv4 VXLAN due to no valid src address found for a multicast packet (VxlanExceptionIPv4NoMcastSrc). |
vxlan-exception-ipv4-no-multicast-source-cpu-id |
uint16 |
Core ID. |
vxlan-exception-ipv4-no-multicast-source-cpu-value |
uint64 |
Core statistic. |
vxlan-exception-ipv4-route |
uint64 |
Number of output packets sent to exception by IPv4 VXLAN due to specific route (VxlanExceptionIPv4Route). |
vxlan-exception-ipv4-route-cpu-id |
uint16 |
Core ID. |
vxlan-exception-ipv4-route-cpu-value |
uint64 |
Core statistic. |
vxlan-exception-ipv6-no-multicast-source |
uint64 |
Number of output packets sent to exception by IPv6 VXLAN due to no valid src address found for a multicast packet (VxlanExceptionIPv6NoMcastSrc). |
vxlan-exception-ipv6-no-multicast-source-cpu-id |
uint16 |
Core ID. |
vxlan-exception-ipv6-no-multicast-source-cpu-value |
uint64 |
Core statistic. |
vxlan-exception-ipv6-route |
uint64 |
Number of output packets sent to exception by IPv6 VXLAN due to specific route (VxlanExceptionIPv6Route). |
vxlan-exception-ipv6-route-cpu-id |
uint16 |
Core ID. |
vxlan-exception-ipv6-route-cpu-value |
uint64 |
Core statistic. |
vxlan-exception-no-input-fdb |
uint64 |
Number of input packets sent to exception by VXLAN due to no valid fdb found (VxlanExceptionNoInputFdb). |
vxlan-exception-no-input-fdb-cpu-id |
uint16 |
Core ID. |
vxlan-exception-no-input-fdb-cpu-value |
uint64 |
Core statistic. |
vxlan-exception-no-output-fdb |
uint64 |
Number of output packets sent to exception by VXLAN due to no valid fdb found (VxlanExceptionNoOutputFdb). |
vxlan-exception-no-output-fdb-cpu-id |
uint16 |
Core ID. |
vxlan-exception-no-output-fdb-cpu-value |
uint64 |
Core statistic. |
vxlan-exception-no-remote |
uint64 |
Number of output packets sent to exception by VXLAN due to no remote found (VxlanExceptionNoRemote). |
vxlan-exception-no-remote-cpu-id |
uint16 |
Core ID. |
vxlan-exception-no-remote-cpu-value |
uint64 |
Core statistic. |
vxlan-exception-ovs-route |
uint64 |
Number of output packets sent to exception by Ovs VXLAN due to specific route (VxlanExceptionOvsRoute). |
vxlan-exception-ovs-route-cpu-id |
uint16 |
Core ID. |
vxlan-exception-ovs-route-cpu-value |
uint64 |
Core statistic. |
vxlan-exception-too-many-flags |
uint64 |
Number of input packets sent to exception by VXLAN due to a presence of an unsupported flag (neither I and G ones, see rfc 7348) (VxlanExceptionTooManyFlags). |
vxlan-exception-too-many-flags-cpu-id |
uint16 |
Core ID. |
vxlan-exception-too-many-flags-cpu-value |
uint64 |
Core statistic. |
vxlan-fdb-forwarding-duplicate-error |
uint64 |
Number of failure to duplicate a packet for fdb forwarding (VxlanFdbForwDuplicateError). |
vxlan-fdb-forwarding-duplicate-error-cpu-id |
uint16 |
Core ID. |
vxlan-fdb-forwarding-duplicate-error-cpu-value |
uint64 |
Core statistic. |
network-nic-eth-stats
The list of eth statistics per network interface.
Measure |
Type |
Description |
|---|---|---|
vrf |
string |
The interface VRF. |
name |
string |
The interface name. |
* |
uint64 |
The driver vendor specific NIC statistics (rx_*, tx_*, etc). |
network-nic-hw-info
The list of network interface hardware information.
Measure |
Type |
Description |
|---|---|---|
name |
string |
The interface name. |
vrf |
string |
The interface vrf. |
driver |
string |
The interface driver used. |
description |
string |
The interface description. |
model |
string |
The interface model. |
pci-address |
string |
The interface pci address. |
speed |
uint64 |
The interface speed. |
carrier-changes |
counter64 |
The interface carrier changes counter. |
carrier-up |
counter64 |
The interface carrier up counter. |
carrier-down |
counter64 |
The interface carrier down counter. |
network-nic-traffic-stats
The list of traffic statistics per network interface.
Measure |
Type |
Description |
|---|---|---|
bytes-recv |
counter64 |
The total number of octets received on the interface, including framing characters. Discontinuities in the value of this counter can occur at re-initialization of the management system, and at other times as indicated by the value of ‘last-clear’. |
in-unicast-pkts |
counter64 |
The number of packets, delivered by this sub-layer to a higher (sub-)layer, that were not addressed to a multicast or broadcast address at this sub-layer. Discontinuities in the value of this counter can occur at re-initialization of the management system, and at other times as indicated by the value of ‘last-clear’. |
in-discards |
counter64 |
The number of inbound packets that were chosen to be discarded even though no errors had been detected to prevent their being deliverable to a higher-layer protocol. One possible reason for discarding such a packet could be to free up buffer space. Discontinuities in the value of this counter can occur at re-initialization of the management system, and at other times as indicated by the value of ‘last-clear’. |
in-errors |
counter64 |
For packet-oriented interfaces, the number of inbound packets that contained errors preventing them from being deliverable to a higher-layer protocol. For character- oriented or fixed-length interfaces, the number of inbound transmission units that contained errors preventing them from being deliverable to a higher-layer protocol. Discontinuities in the value of this counter can occur at re-initialization of the management system, and at other times as indicated by the value of ‘last-clear’. |
bytes-sent |
counter64 |
The total number of octets transmitted out of the interface, including framing characters. Discontinuities in the value of this counter can occur at re-initialization of the management system, and at other times as indicated by the value of ‘last-clear’. |
out-unicast-pkts |
counter64 |
The total number of packets that higher-level protocols requested be transmitted, and that were not addressed to a multicast or broadcast address at this sub-layer, including those that were discarded or not sent. Discontinuities in the value of this counter can occur at re-initialization of the management system, and at other times as indicated by the value of ‘last-clear’. |
out-discards |
counter64 |
The number of outbound packets that were chosen to be discarded even though no errors had been detected to prevent their being transmitted. One possible reason for discarding such a packet could be to free up buffer space. Discontinuities in the value of this counter can occur at re-initialization of the management system, and at other times as indicated by the value of ‘last-clear’. |
out-errors |
counter64 |
For packet-oriented interfaces, the number of outbound packets that could not be transmitted because of errors. For character-oriented or fixed-length interfaces, the number of outbound transmission units that could not be transmitted because of errors. Discontinuities in the value of this counter can occur at re-initialization of the management system, and at other times as indicated by the value of ‘last-clear’. |
network-twamp-stats
The list of TWAMP client sessions and their statistics.
Measure |
Type |
Description |
|---|---|---|
starts |
date-and-time |
The start date of the test session. |
clock-sync |
boolean |
Indicate if the clock between the sender and the reflector seems synchronized. If not, only the round-trip statistics are relevant. |
send-hops-average |
uint8 |
Hops average between the sender and the reflector. |
reflect-hops-average |
uint8 |
Hops average between the reflector and the sender. |
packets-lost-average |
uint32 |
The average of packets responses not received back from reflector before timeout expired. |
round-trip-delay-minimum |
int64 |
The minimum observed delay. |
round-trip-delay-median |
int64 |
The median value for observed delays. |
round-trip-delay-average |
int64 |
The median value for observed delays. |
round-trip-delay-maximum |
int64 |
The maximum observed delay. |
send-delay-minimum |
int64 |
The minimum observed delay. |
send-delay-median |
int64 |
The median value for observed delays. |
send-delay-average |
int64 |
The median value for observed delays. |
send-delay-maximum |
int64 |
The maximum observed delay. |
reflect-delay-minimum |
int64 |
The minimum observed delay. |
reflect-delay-median |
int64 |
The median value for observed delays. |
reflect-delay-average |
int64 |
The median value for observed delays. |
reflect-delay-maximum |
int64 |
The maximum observed delay. |
round-trip-jitter-median |
int64 |
The median value for observed jitters. |
round-trip-jitter-average |
int64 |
The median value for observed jitters. |
send-jitter-median |
int64 |
The median value for observed jitters. |
send-jitter-average |
int64 |
The median value for observed jitters. |
reflect-jitter-median |
int64 |
The median value for observed jitters. |
reflect-jitter-average |
int64 |
The median value for observed jitters. |
product-license
The license detailed information.
Measure |
Type |
Description |
|---|---|---|
enabled |
boolean |
True if the license daemon is enabled on the system. |
valid |
boolean |
True if the license is valid. |
state |
string |
The license state. |
activation-type |
string |
How the license was activated. |
license-type |
string |
The license type. |
short-license-type |
enumeration |
A shorter version of the license type. |
subscription-end-date |
string |
The subscription or evaluation end date. |
support-type |
enumeration |
The type of support (none, standard or extended). |
support-end-date |
string |
The support end date. |
remaining-days-count |
int32 |
The remaining days until support end date. |
remaining-days |
string |
The remaining days until support end date, in string format. |
licensed-feature-name |
string |
The name of the feature. |
licensed-feature-enabled |
boolean |
The status of the feature. |
licensed-feature-counter-name |
string |
The name of the counter. |
licensed-feature-counter-description |
string |
The description of the counter. |
licensed-feature-counter-allowed |
union |
The number of objects allowed. |
licensed-feature-counter-used |
used-resource |
The number of objects used. |
online-serial |
string |
The currently used serial number. |
online-connected |
boolean |
True if the cloud license server is reachable. |
online-last-healthcheck-date |
string |
The last contact with license server date. |
online-lease-end-date |
string |
The end of the license lease date. |
online-current-activations |
uint32 |
How many devices already hold this license. |
online-allowed-activations |
uint32 |
How many devices can hold this license at a time. |
online-license-tokens |
uint32 |
How many tokens are authorized by license. |
online-computer-id |
string |
This computer ID. |
online-vrf |
vrf-name |
The VRF to use for connecting to the license server. |
online-proxy-host |
host |
The hostname or address of an HTTP proxy to use for connecting to the online license server. |
online-proxy-port |
port-number |
The TCP port of the HTTP proxy server. |
online-proxy-user |
string |
The username for connecting to the HTTP proxy server. |
online-proxy-password |
union |
The password for connecting to the HTTP proxy server. |
online-export-analytics |
boolean |
True if the analytics are exported to the license server. |
online-use-ipv6-dns |
boolean |
True if the licensing server is accessed using IPv6. |
online-source-ip |
ip-address |
Source address used to join the server. |
offline-certificate-serial |
string |
The currently used serial number. |
offline-certificate-computer-id |
string |
This computer ID. |
offline-serial |
string |
The currently used serial number. |
snmp |
boolean |
True if the snmp agent is enabled, else false. |
product-version
The product version.
Measure |
Type |
Description |
|---|---|---|
product:version |
string |
Version currently running. |
system-cpu-times
The list of CPU times per CPU.
Measure |
Type |
Description |
|---|---|---|
cpu |
string |
The CPU number. |
user |
decimal64 |
The percentage of CPU usage spent in user mode. |
nice |
decimal64 |
The percentage of CPU usage spent in user mode with nice priority. |
system |
decimal64 |
The percentage of CPU usage spent in kernel mode. |
idle |
decimal64 |
The percentage of CPU usage spent doing nothing. |
iowait |
decimal64 |
The percentage of CPU usage spent waiting for I/O to complete. |
irq |
decimal64 |
The percentage of CPU usage spent servicing hardware interrupts. |
softirq |
decimal64 |
The percentage of CPU usage spent servicing software interrupts. |
steal |
decimal64 |
The percentage of CPU usage spent in involuntary wait by the virtual CPU or CPUs while the hypervisor was servicing another virtual processor. |
guest |
decimal64 |
The percentage of CPU usage spent running a virtual processor. |
guest-nice |
decimal64 |
The percentage of CPU usage spent running a virtual processor with nice property. |
system-cpu-usage
The list of busy percentage per CPU.
Measure |
Type |
Description |
|---|---|---|
cpu |
string |
The CPU number. |
busy |
uint16 |
The busy percentage. |
system-disk-usage
The disk usage information per device.
Measure |
Type |
Description |
|---|---|---|
disk |
string |
The disk name. |
total |
uint64 |
The disk total size. |
free |
uint64 |
The disk free size. |
system-memory
The total and available memory.
Measure |
Type |
Description |
|---|---|---|
available |
uint64 |
The memory that can be given instantly to processes without the system going into swap. |
total |
uint64 |
The total physical memory. |
system-numa-stats
The list of current NUMA-nodes and their statistics.
Measure |
Type |
Description |
|---|---|---|
node |
string |
Numa node unique identifier. |
numa-hit |
uint64 |
Number of pages successfully allocated to this node as intended. |
numa-miss |
uint64 |
Number of pages allocated on this node despite the process preferring some different node. |
numa-foreign |
uint64 |
Number of pages intended for this node but actually allocated on some different node. |
interleave-hit |
uint64 |
Number of interleave policy pages successfully allocated to this node. |
local-node |
uint64 |
Number of pages successfully allocated on this node by a process on this node. |
other-node |
uint64 |
Number of pages allocated on this node by a process on another node. |
system-power
The power relate metrics (consumption, frequency, processor sleep states). The data is only available when directly running on an Intel server.
Measure |
Type |
Description |
|---|---|---|
global-cpu-power |
decimal64 |
Total CPU(s) consumption. |
cpu |
string |
The CPU number. |
per-cpu-busy |
uint8 |
The busy percentage, i.e. when the processor is not in an hardware sleep state. |
per-cpu-idle |
uint8 |
The busy percentage, i.e. when the processor is in an hardware sleep state. |
per-cpu-frequency |
uint32 |
The current cpu frequency. |
system-processes
The list of processes on the system.
Measure |
Type |
Description |
|---|---|---|
name |
string |
The name of the process. |
pid |
uint64 |
The pid of the process. |
fds |
uint32 |
The number of file descriptors opened by this process. |
memory |
uint64 |
The memory used by this process. |
busy |
decimal64 |
The busy percentage for this process. |
voluntary-context-switches |
uint64 |
The number of voluntary context switches. |
involuntary-context-switches |
uint64 |
The number of involuntary context switches. |
system-soft-interrupts-stats
The list of soft interrupts statistics per CPU.
Measure |
Type |
Description |
|---|---|---|
cpu |
string |
The CPU number. |
hi |
uint64 |
Number of high priority tasklets. |
timer |
uint64 |
Number of timer interrupts. |
net-tx |
uint64 |
Number of interrupts for transmitting packets to network cards. |
net-rx |
uint64 |
Number of interrupts for receiving packets from network cards. |
irq-poll |
uint64 |
Number of polling interrupts. |
block |
uint64 |
Number of block-device I/O interrupts. |
tasklet |
uint64 |
Number of regular tasklets interrupts. |
high-resolution-timer |
uint64 |
Number of high resolution timer interrupts. |
sched |
uint64 |
Number of scheduling interrupts. |
rcu |
uint64 |
Number of read-copy-update interrupts. |
system-uptime
The system uptime.
Measure |
Type |
Description |
|---|---|---|
system:uptime |
string |
A human readable value (e.g DD days, HH:mm:ss). |
system-user-count
The number of logged user sessions.
Measure |
Type |
Description |
|---|---|---|
session-count |
uint16 |
The number of running sessions. |
system-users
The list of logged user sessions.
Measure |
Type |
Description |
|---|---|---|
terminal |
string |
The terminal name. |
user |
string |
The user. |
source |
string |
The host from where the user logged in. |
started |
string |
The date at which the connection was started. |